Recently I was in New York giving a talk at O'Reilly Velocity on the topic of troubleshooting Kubernetes apps and, motivated by the positive feedback and great discussions on the topic, I decided to revisit tooling in the space. It turns out that, besides kubernetes-incubator/spartakus and kubernetes/kube-state-metrics, we don't really have much lightweight tooling available to collect resource stats (such as the number of pods or services in a namespace). So, I sat down on my way home and started coding on a little tool—creatively named krs, which is short for Kubernetes Resource Stats—that allows you to gather these stats.
You can use mhausenblas/krs in two ways:
- directly from the command line (binaries for Linux, Windows, and MacOS are available); and
- in cluster, as a deployment, using the launch.sh script, which creates the appropriate role-based access control (RBAC) permissions on the fly.
Mind you, it's very early days, and this is heavily a work in progress. However, the 0.1 release of krs offers the following features:
- In a per-namespace basis, it periodically gathers resource stats (supporting pods, deployments, and services).
- It exposes these stats as metrics in the OpenMetrics format.
- It can be used directly via binaries or in a containerized setup with all dependencies included.
In its current form, you need to have kubectl installed and configured for krs to work, because krs relies on a kubectl get all command to be executed to gather the stats. (On the other hand, who's using Kubernetes and doesn't have kubectl installed?)
Using krs is simple; Download the binary for your platform and execute it like this:
$ krs thenamespacetowatch
# HELP pods Number of pods in any state, for example running
# TYPE pods gauge
pods{namespace="thenamespacetowatch"} 13
# HELP deployments Number of deployments
# TYPE deployments gauge
deployments{namespace="thenamespacetowatch"} 6
# HELP services Number of services
# TYPE services gauge
services{namespace="thenamespacetowatch"} 4
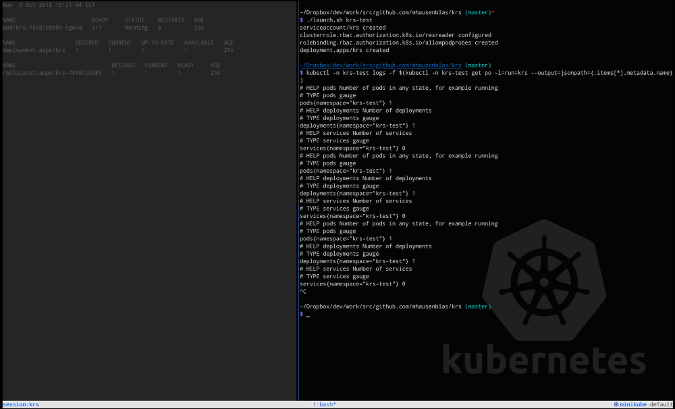
This will launch krs in the foreground, gathering resource stats from the namespace thenamespacetowatch and outputting them respectively in the OpenMetrics format on stdout for you to further process.

Screenshot of krs in action.
But Michael, you may ask, why isn't it doing something useful (such as storing 'em in S3) with the metrics? Because Unix philosophy.
For those wondering if they can directly use Prometheus or kubernetes/kube-state-metrics for this task: Well, sure you can, why not? The emphasis of krs is on being a lightweight and easy-to-use alternative to already available tooling—and maybe even being slightly complementary in certain aspects.
This was originally published on Medium's ITNext and is reprinted with permission.


Comments are closed.