In my previous article, I introduced Skipper, an open source HTTP router and reverse proxy for service composition. This article focuses on how Skipper increases network visibility and describes its advantages for both developers of scalable applications and operators of the infrastructure they run on.
What is network visibility?
What is visibility, and what do we need to achieve to support it? Charity Majors provides a good answer on Twitter:
Monitoring is for operating software/systems
Instrumentation is for writing software
Observability is for understanding systems— Charity Majors (@mipsytipsy) September 23, 2017
As an HTTP routing provider, Skipper wants to provide visibility to application developers. At e-commerce retailer Zalando, our developers in feature teams want to monitor their systems to understand failure rates (%), throughput (request per second, or RPS), and latencies (e.g., p50, p99, p999). Skipper library users who want to instrument their custom proxies can use Skipper's metrics package to instrument their proxies and create custom metrics.
Operators need observability to understand how the system behaves in general and at certain points in time, so they're ready when someone asks, "What happened yesterday at 2:30am?" or "How would this request be processed?" Skipper can help answer these questions by increasing backend applications' visibility.
Monitoring backend applications
For the purposes of this article, I'll define a backend application as an arbitrary HTTP service that is running behind the Skipper HTTP proxy.
Application owners running workloads want to monitor the four golden signals: latency, traffic, errors, and saturation. An HTTP router like Skipper is in a good position in the call path to provide three of the four—latency, traffic, and errors—for backends. But saturation is a complex target in practice; it has to be monitored at the node, control group, or application level, so it is out of scope for this article.
Metrics
Skipper exposes response latencies, RPS throughput, and OK and failure rates for routes and aggregated routes. These are the basic signals that application owners need to get alerts on, so they can take action as needed.
Skipper can serve different application metrics depending on your needs. Metrics can be collected by Host header or by route. If you start Skipper with -serve-host-metrics, you can collect and expose metrics grouped by Host header. If you need more details, you can use -serve-route-metrics to split metrics by route, status code, and method.
Keep in mind that nothing comes for free, and having more metrics is not always better. You will pay for storing and querying metrics with memory usage in Skipper and in your time-series database (TSDB).
You can also choose whether your metrics are exposed in Coda Hale or Prometheus format. The Coda Hale metrics expose latencies pre-aggregated in pN, e.g., p99. One drawback of these pre-aggregated metrics is that you will not get statistically correct p99 across all instances. If you want to have proper pN calculated across all Skipper instances, I recommend using Prometheus to scrape Skipper instances. Then you can query Prometheus to calculate latencies, errors, and throughput.
Latency
To get response latencies for backends, you can use the PromQL query shown in Figure 1. This query will get p99 latencies split by host header for the last minute:
Figure 1:
histogram_quantile(
  0.99,
  sum(rate(skipper_serve_host_duration_seconds_bucket{}[1m]))
  by (le,host)
)
(Sandor Szuecs, CC BY-SA 4.0)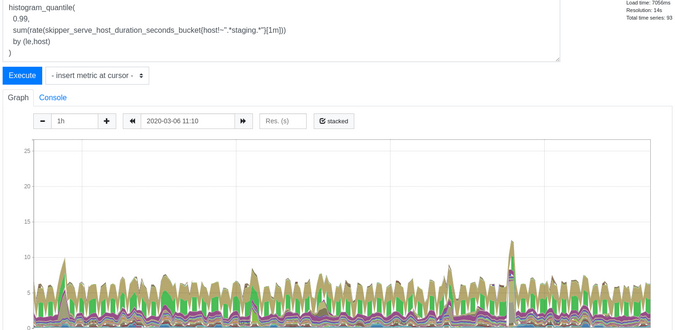
Traffic
To get the throughput data, you can use the query shown in Figure 2. This PromQL query shows RPS split by host header:
Figure 2:
sum(rate(skipper_serve_host_duration_seconds_count{}[1m])) by (host)
(Sandor Szuecs, CC BY-SA 4.0)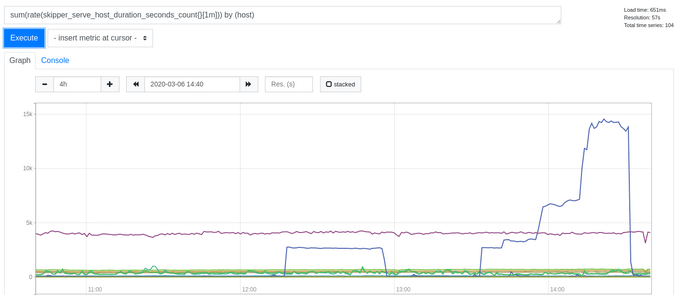
Errors
You have several options for monitoring errors in Skipper. To get HTTP status code 4xx and 5xx errors per second by host header, use the query shown in Figure 3:
Figure 3:
sum(rate(skipper_serve_host_duration_seconds_count{code=~"[45].."}[1m]))
by (host)
/
sum(rate(skipper_serve_host_duration_seconds_count{}[1m]))
by (host)
If you just want to see errors, use the query in Figure 4:
Figure 4:
sum(rate(skipper_serve_host_duration_seconds_count{code=~"[45].."}[10m])) by (host)
(Sandor Szuecs, CC BY-SA 4.0)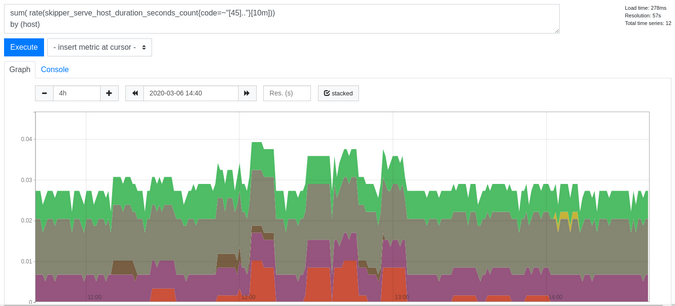
If you want to see the success rate percentage, use the query in Figure 5:
Figure 5:
(
  sum(rate(skipper_serve_host_duration_seconds_count{}[10m])) by (host)
  - sum(rate(skipper_serve_host_duration_seconds_count{code=~"[45].."}[10m])) by (host)
) / sum(rate(skipper_serve_host_duration_seconds_count{}[10m])) by (host)
(Sandor Szuecs, CC BY-SA 4.0)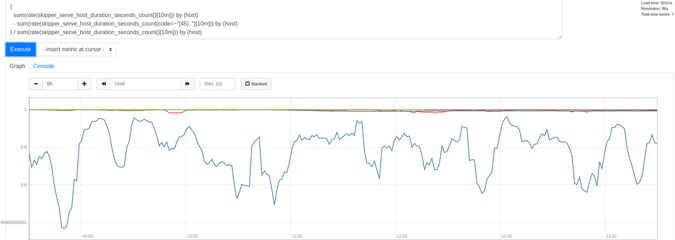
Access logs
Skipper also provides access logs, which are very valuable. You can use enableAccessLog and disableAccessLog filters to control log output by status code for individual routes. Access logs also contain data that you can track back to individual clients. For example, you can use the unverifiedAuditLog filter to log parts of the JSON Web Token (JWT) that will identify a client. This helps application owners understand which client has what kind of access pattern.
Skipper supports structured logs in JSON or Apache 2-style access log formats. The Apache format is good for reading by humans, and there is a huge ecosystem that you can use with it. If you want to process the logs with your machines, you might want to use the JSON format.
Often, multiple applications or services are used for an end-user website, like a web shop. For investigations, you want to see all logs for a single user transaction, so you can understand errors and fix things behind the scenes. How about having a business trace ID in logs in all your applications? At Zalando, we implemented event logs using a flowID identifier, which was passed as an HTTP header. Skipper has a flowID filter and will also write the value into your access log. This enables you to easily find all the access logs for one business transaction without newer toolkits like distributed tracing.
Distributed tracing
Distributed tracing is important in the modern visibility toolkit. We use this term for the ecosystem provided by OpenTelemetry, formerly known as OpenTracing and OpenCensus.
Distributed tracing provides a completely different view of distributed systems. For example, you can get the type of waterfall chart shown in Figure 6. It shows multiple services doing different operations, all measured with time duration. The initial HTTP GET / dispatch span on the left opens two other spans: an HTTP GET /customer call and a Driver::findNearest Redis operation.
(Sandor Szuecs, CC BY-SA 4.0)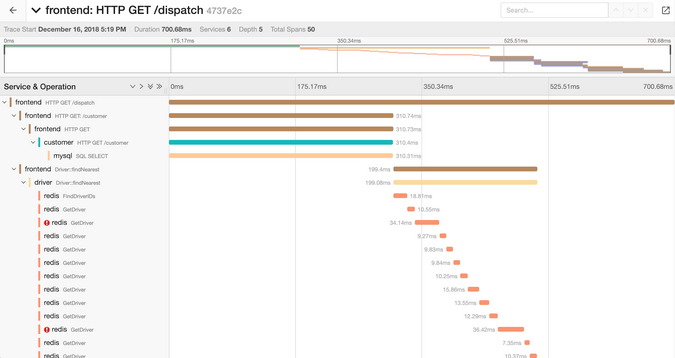
This is a lot of visibility!
You can find more details about Skipper's distributed tracing support below.
Operations
Operators of distributed services want to see how the edge proxy is running. They want to know if Skipper is healthy, if it is causing latency to applications, and, if so, what is consuming the time. They also want to differentiate between a backend problem and an HTTP router problem to decrease mean time to repair.
Most applications should provide core metrics like memory and CPU usage, but this is not enough for such an important component that serves the backbone of an entire business—backend latencies, RPS throughput, error rates, connection states, queue states, and restarts are very important, too. Skipper is written in Go, which exposes some interesting runtime metrics, such as memory, garbage collection details, number of threads, and goroutines. All of these metrics are exported on the support listener, which defaults to :9911/metrics.
Figure 7 shows a Skipper dashboard that has a collection of cluster-wide graphs. The first row shows throughput, backend latencies, and data about process concurrency. These graphs show important cluster patterns and whether the HTTP routing and backends are healthy. A hardware change can alter the number of threads in use by the Go runtime or the compute throughput per instance. In the second row, you can see HTTP status codes 2xx, 4xx, and 5xx to get an overall view of errors and understand what is considered "normal."
Figure 7:
(Sandor Szuecs, CC BY-SA 4.0)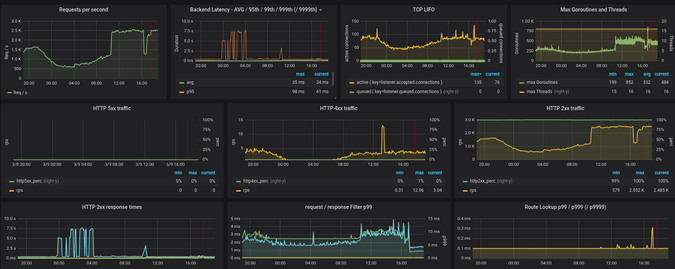
Figure 8 shows additional runtime and capacity details. The graph showing requests split by host header enables you to identify access patterns to applications.
Figure 8:
(Sandor Szuecs, CC BY-SA 4.0)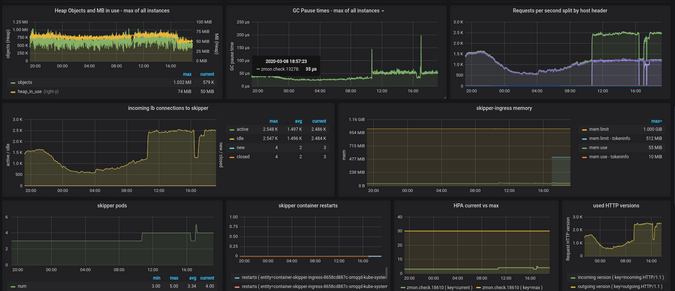
The bottom part of Figure 9 shows the CPU usage of two different containers. The top shows filters and the LIFO (last in, first out) queue, which need more explanation. For example, if users start to use the compress() filter, you might see slower response filters and increased CPU usage because now you're using the CPU for compression algorithms and not only for shifting packets. If developers start to use auth filters that call external APIs like webhook() or oauth*, the request filters runtime also counts roundtrips to these endpoints. This information shows whether an observed application latency is a side effect of something more global, like slow tokeninfo endpoints. Figure 9 shows that at 17:00 there were new metrics for tokeninfo CPU usage. I deployed the tokeninfo auth endpoint as a sidecar, which reduced the filter latencies
and also the Skipper CPU usage.
Figure 9:
(Sandor Szuecs, CC BY-SA 4.0)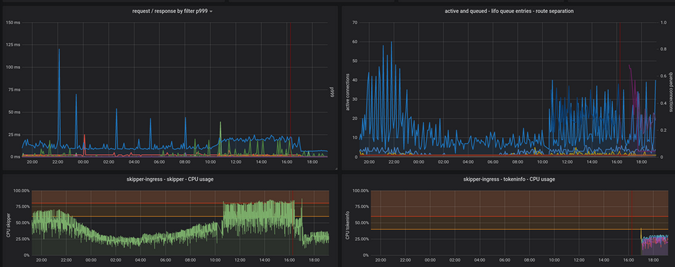
Distributed tracing
If you look back at the waterfall chart in Figure 6, you can see request flows throughout the application. That information is provided by a tracing library. Skipper currently supports tracing providers Instana, Jaeger, and Lightstep, so you can choose to use a SaaS provider or the open source version.
Traces provided by your distributed tracing provider are nice, but if you look into the details, you can gain so much more than from a waterfall chart alone.
In distributed tracing, a trace consists of connected spans. Spans have a service, an operation, and a duration, but they can also contain metadata like tags and logs. With Skipper, you can set process global tags, like environment, hostname, cluster name, or cloud provider. This is useful to filter and group your traces.
Skipper provides five spans for each operation:
- Ingress: parent span, HTTP handler including route lookup
- Request filter: processes request filters
- Auth filter: interacts with your authorization provider
- Proxy: wraps the backend call
- Response filter: processes response filters
For example, in the Request filters span in Figure 10, you can see the time spent running all the individual filters of the route in the logs.
Figure 10:
(Sandor Szuecs, CC BY-SA 4.0)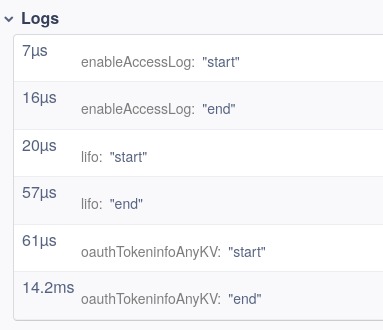
In the Proxy span, the logs show how much time the dial, the TCP/IP connection and TLS handshake, the HTTP roundtrip to the backend, and the streaming of headers and data to the client took. Even without instrumented backends, as you can see in Figure 11, the backend took roughly 90ms, and the dial_context, TCP/IP, and TLS handshake took 1.04ms.
Figure 11:
(Sandor Szuecs, CC BY-SA 4.0)
In case you need to instrument your Go application, you can use the Skipper HTTP client that provides detailed logs in the client span. For example, Figure 12 shows the tokeninfo and auth filter span that are using the Client:
Figure 12:
(Sandor Szuecs, CC BY-SA 4.0)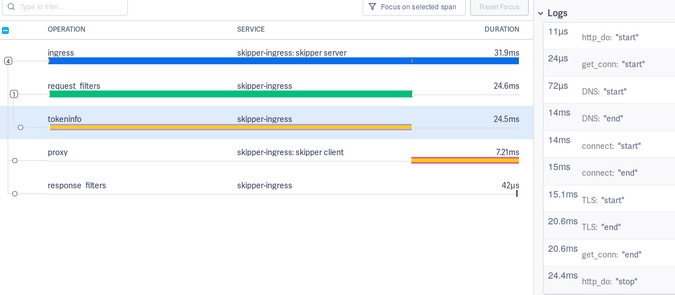
More details can be found in Skipper's OpenTracing documentation.
Routing table
Like any other HTTP router, Skipper has a routing table or, to be more precise, a routing tree (as explained in my previous article). Using a tree structure allows you to scale the number of routes and get good performance during the lookup. This enables Skipper to run with more than 600,000 routes in one instance.
As an operator, you sometimes have to investigate routing problems. It would be nice not to have to work on a configuration source but instead to have an online view of the routing tree. With the -support-listener, Skipper enables you to dump an instance's current routing table. Figure 13 shows how to dump parts of the routing table. In this case, using an offset= 10 and a limit=1 will print only the tenth route:
Figure 13:
% curl "localhost:9911/routes?offset=10&limit=1"
kube_default__foo__foo_teapot_example_org_____foo: Host(/^foo[.]teapot[.]example[.]org$/) && PathSubtree("/")
  -> enableAccessLog(4, 5)
  -> lifo(2000, 20000, "3s")
  -> setRequestHeader("X-Foo", "hello-world")
  -> <roundRobin, "http://10.2.0.225:9090", "http://10.2.1.244:9090">;
Debugging requests
My previous article showed that Skipper filters can change the request passed to the backend. But how do you investigate the outgoing request? People often try to use debug logs or to SSH into the machine and use tcpdump to dump everything to find the outgoing request.
Skipper provides a better way to inspect a transformed request. By using the debug listener, -debug-listener=:9922, Skipper can show information about the incoming and outgoing request. In Figure 14, you can see that the outgoing request applied the X-Foo: hello-world request header that was added by the filter setRequestHeader("X-Foo", "hello-world") in Figure 13.
Figure 14:
% curl -s http://127.0.0.1:9922/ -H"Host: foo.teapot.example.org" | jq .
{
  "route_id": "kube_default__foo__foo_teapot_example_org_____foo",
  "route": "Host(/^foo[.]teapot[.]example[.]org$/) && PathSubtree(\"/\") -> enableAccessLog(4, 5) -> lifo(2000, 20000, \"3s\") -> setRequestHeader(\"X-Foo\", \"hello-world\") -> <roundRobin, \"http://10.2.0.225:9090\", \"http://10.2.1.244:9090\">",
  "incoming": {
    "method": "GET",
    "uri": "/",
    "proto": "HTTP/1.1",
    "header": {
      "Accept": [
        "*/*"
      ],
      "User-Agent": [
        "curl/7.49.0"
      ]
    },
    "host": "foo.teapot.example.org",
    "remote_address": "127.0.0.1:32992"
  },
  "outgoing": {
    "method": "GET",
    "uri": "",
    "proto": "HTTP/1.1",
    "header": {
      "Accept": [
        "*/*"
      ],
      "User-Agent": [
        "curl/7.49.0"
      ],
      "X-Foo": [
        "hello-world"
      ]
    },
    "host": "foo.teapot.example.org"
  },
  "response_mod": {
    "header": {
      "Server": [
        "Skipper"
      ]
    }
  },
  "filters": [
    {
      "name": "enableAccessLog",
      "args": [
        4,
        5
      ]
    },
    {
      "name": "lifo",
      "args": [
        2000,
        20000,
        "3s"
      ]
    },
    {
      "name": "setRequestHeader",
      "args": [
        "X-Foo",
        "hello-world"
      ]
    }
  ],
  "predicates": [
    {
      "name": "PathSubtree",
      "args": [
        "/"
      ]
    }
  ]
}
Summing up
This article showed how Skipper enables you to increase the visibility of your HTTP routing system. I hope this gives you the information you need to increase observability, but if you have any questions, please share them in the comments below.


Comments are closed.