Server and application logging is an important facility for developers, operators, and security teams to understand an application's state running in their production environment.
Logging allows operators to determine if the applications and the required components are running smoothly and detect if something unusual is happening so they can react to the situation.
For developers, logging gives visibility to troubleshoot the code during and after development. In a production setting, the developer usually relies on a logging facility without debugging tools. Coupled with logging from the systems, developers can work hand in hand with operators to effectively troubleshoot issues.
The most important beneficiary of logging facilities is the security team, especially in a cloud-native environment. Having the ability to collect information from applications and system logs enables the security team to analyze the data from authentication, application access to malware activities where they can respond to them if needed.
Kubernetes is the leading container platform where more and more applications get deployed in production. I believe that understanding the logging architecture of Kubernetes is a very important endeavor that every Dev, Ops, and Security team needs to take seriously.
In this article, I discuss how different container logging patterns in Kubernetes work.
System logging and application logging
Before I dig deeper into the Kubernetes logging architecture, I'd like to explore the different logging approaches and how both functionalities are critical features of Kubernetes logging.
There are two types of system components: Those that run in a container and those that do not. For example:
- The Kubernetes scheduler and
kube-proxyrun in a container. - The
kubeletand container runtime do not run in containers.
Similar to container logs, system container logs get stored in the /var/log directory, and you should rotate them regularly.
Here I consider container logging. First, I look at cluster-level logging and why it is important for cluster operators. Cluster logs provide information about how the cluster performs. Information like why pods got evicted or the node dies. Cluster logging can also capture information like cluster and application access and how the application utilizes compute resources. Overall, a cluster logging facility provides the cluster operators information that is useful for cluster operation and security.
The other way to capture container logs is through the application's native logging facility. Modern application design most likely has a logging mechanism that helps developers troubleshoot application performance issues through standard out (stdout) and error streams (stderr).
To have an effective logging facility, Kubernetes implementation requires both app and system logging components.
3 types of Kubernetes container logging
There are three prominent methods of cluster-level logging that you see in most of the Kubernetes implementations these days.
- Node-level logging agent
- Sidecar container application for logging
- Exposing application logs directly to logging backend
Node level logging agent
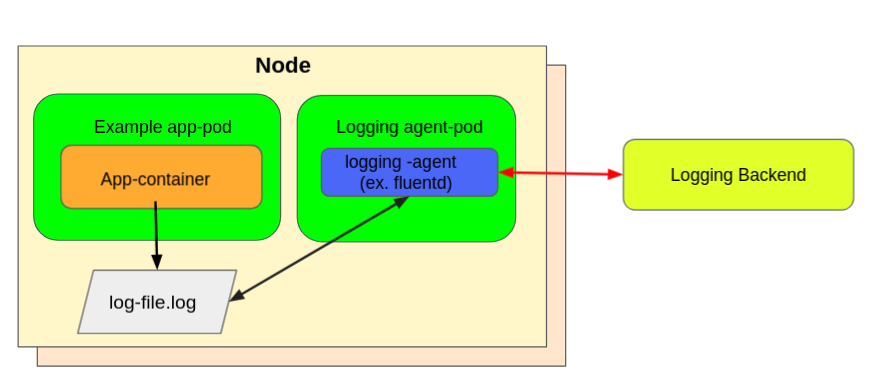
I'd like to consider the node-level logging agent. You usually implement these using a DaemonSet as a deployment strategy to deploy a pod (which acts as a logging agent) in all the Kubernetes nodes. This logging agent then gets configured to read the logs from all Kubernetes nodes. You usually configure the agent to read the nodes /var/logs directory capturing stdout/stderr streams and send it to the logging backend storage.
The figure below shows node-level logging running as an agent in all the nodes.
(Mike Calizo, CC BY-SA 4.0)
To set up node-level logging using the fluentd approach as an example, you need to do the following:
- First, you need to create a ServiceAccount called
fluentdd. This service account gets used by the Fluentd Pods to access the Kubernetes API, and you need to create them in the logging Namespace with the labelapp: fluentd.#fluentd-SA.yaml apiVersion: v1 kind: ServiceAccount metadata: name: fluentd namespace: logging labels: app: fluentdYou can view the complete example in this repo.
- You then need to create a ConfigMap
fluentd-configmap. This provides a config file to thefluentd daemonsetwith all the required properties.#fluentd-daemonset.yaml apiVersion: extensions/v1beta1 kind: DaemonSet metadata: name: fluentd namespace: logging labels: app: fluentd kubernetes.io/cluster-service: "true" spec: selector: matchLabels: app: fluentd kubernetes.io/cluster-service: "true" template: metadata: labels: app: fluentd kubernetes.io/cluster-service: "true" spec: serviceAccount: fluentd containers: - name: fluentd image: fluent/fluentd-kubernetes-daemonset:v1.7.3-debian-elasticsearch7-1.0 env: - name: FLUENT_ELASTICSEARCH_HOST value: "elasticsearch.logging.svc.cluster.local" - name: FLUENT_ELASTICSEARCH_PORT value: "9200" - name: FLUENT_ELASTICSEARCH_SCHEME value: "http" - name: FLUENT_ELASTICSEARCH_USER value: "elastic" - name: FLUENT_ELASTICSEARCH_PASSWORD valueFrom: secretKeyRef: name: efk-pw-elastic key: password - name: FLUENT_ELASTICSEARCH_SED_DISABLE value: "true" resources: limits: memory: 512Mi requests: cpu: 100m memory: 200Mi volumeMounts: - name: varlog mountPath: /var/log - name: varlibdockercontainers mountPath: /var/lib/docker/containers readOnly: true - name: fluentconfig mountPath: /fluentd/etc/fluent.conf subPath: fluent.conf terminationGracePeriodSeconds: 30 volumes: - name: varlog hostPath: path: /var/log - name: varlibdockercontainers hostPath: path: /var/lib/docker/containers - name: fluentconfig configMap: name: fluentdconfYou can view the complete example in this repo.
Now, I look at the code on how to deploy a fluentd daemonset as the log agent.
#fluentd-daemonset.yaml
apiVersion: extensions/v1beta1
kind: DaemonSet
metadata:
  name: fluentd
  namespace: logging
  labels:
    app: fluentd
    kubernetes.io/cluster-service: "true"
spec:
  selector:
    matchLabels:
      app: fluentd
      kubernetes.io/cluster-service: "true"
  template:
    metadata:
      labels:
        app: fluentd
        kubernetes.io/cluster-service: "true"
    spec:
      serviceAccount: fluentd
      containers:
      - name: fluentd
        image: fluent/fluentd-kubernetes-daemonset:v1.7.3-debian-elasticsearch7-1.0
        env:
          - name:  FLUENT_ELASTICSEARCH_HOST
            value: "elasticsearch.logging.svc.cluster.local"
          - name:  FLUENT_ELASTICSEARCH_PORT
            value: "9200"
          - name: FLUENT_ELASTICSEARCH_SCHEME
            value: "http"
          - name: FLUENT_ELASTICSEARCH_USER
            value: "elastic"
          - name: FLUENT_ELASTICSEARCH_PASSWORD
            valueFrom:
              secretKeyRef:
                name: efk-pw-elastic
                key: password
          - name: FLUENT_ELASTICSEARCH_SED_DISABLE
            value: "true"
        resources:
          limits:
            memory: 512Mi
          requests:
            cpu: 100m
            memory: 200Mi
        volumeMounts:
        - name: varlog
          mountPath: /var/log
        - name: varlibdockercontainers
          mountPath: /var/lib/docker/containers
          readOnly: true
        - name: fluentconfig
          mountPath: /fluentd/etc/fluent.conf
          subPath: fluent.conf
      terminationGracePeriodSeconds: 30
      volumes:
      - name: varlog
        hostPath:
          path: /var/log
      - name: varlibdockercontainers
        hostPath:
          path: /var/lib/docker/containers
      - name: fluentconfig
        configMap:
name: fluentdconfTo put this together:
kubectl apply -f fluentd-SA.yaml \
              -f fluentd-configmap.yaml \
              -f fluentd-daemonset.yaml
Sidecar container application for logging
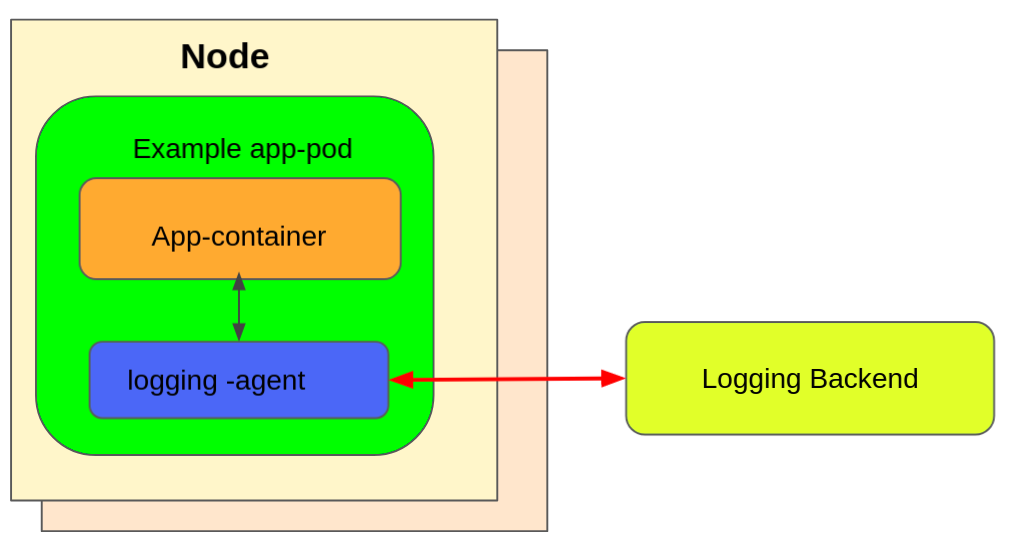
The other approach is by using a dedicated sidecar container with a logging agent. The most common implementation of the sidecar container is by using Fluentd as a log collector. In the enterprise deployment (where you won't worry about a little compute resource overhead), a sidecar container using fluentd (or similar) implementation offers flexibility over cluster-level logging. This is because you can tune and configure the collector agent based on the type of logs, frequency, and other possible tunings you need to capture.
The figure below shows a sidecar container as a logging agent.

(Mike Calizo, CC BY-SA 4.0)
For example, a pod runs a single container, and the container writes to two different log files using two different formats. Here's a configuration file for the pod:
#log-sidecar.yaml
apiVersion: v1
kind: Pod
metadata:
  name: counter
spec:
  containers:
  - name: count
    image: busybox
    args:
    - /bin/sh
    - -c
    - >
      i=0;
      while true;
      do
        echo "$i: $(date)" >> /var/log/1.log;
        echo "$(date) INFO $i" >> /var/log/2.log;
        i=$((i+1));
        sleep 1;
      done
    volumeMounts:
    - name: varlog
      mountPath: /var/log
  - name: count-log
    image: busybox
    args: [/bin/sh, -c, 'tail -n+1 -f /var/log/1.log']
    volumeMounts:
    - name: varlog
      mountPath: /var/log
  volumes:
  - name: varlog
    emptyDir: {}
To put this together, you can run this pod:
$ kubectl apply -f log-sidecar.yamlTo verify if the sidecar container works as a logging agent, you can do:
$ kubectl logs counter count-logThe expected output should look like this:
$ kubectl logs counter count-log-1

Thu 04 Nov 2021 09:23:21 NZDT
Thu 04 Nov 2021 09:23:22 NZDT
Thu 04 Nov 2021 09:23:23 NZDT
Thu 04 Nov 2021 09:23:24 NZDT
Exposing application logs directly to logging backend
The third approach, which (in my opinion) is the most flexible logging solution for Kubernetes container and application logs, is by pushing the logs directly to the logging backend solution. Although this pattern does not rely on the native Kubernetes capability, it offers flexibility that most enterprises need like:
- Extend a wider variety of support for network protocols and output formats.
- Allows load balancing capability and enhances performance.
- Configurable to accept complex logging requirements through upstream aggregation
Because this third approach relies on a non-Kubernetes feature by pushing logs directly from every application, it is outside the Kubernetes scope.
Conclusion
The Kubernetes logging facility is a very important component for an enterprise deployment of a Kubernetes cluster. I discussed three possible patterns that are available for use. You need to find a suitable pattern for your needs.
As shown, the node-level logging using daemonset is the easiest deployment pattern to use, but it also has some limitations that might not fit your organization's needs. On the other hand, the sidecar pattern offers flexibility and customization that allows you to customize what type of logs to capture, giving you compute resource overhead. Finally, exposing application logs directly to the backend log facility is another enticing approach that allows further customization.
The choice is yours. You just need to find the approach that fits your organization's requirements.


Comments are closed.