At its heart, Creative Commons is a simple idea. It’s the idea that when people share their creativity and knowledge with each other, amazing things can happen.
It’s not a new idea. People have been adapting and building on each other’s work for centuries. Musicians sample beats from each other’s music. Artists create entirely new works from other people’s images. Teachers borrow each other’s activities and lesson plans. Scientists build off of each other’s results to make new discoveries.
We believe that sharing—sometimes it happens in an instant, sometimes it spreads across generations—is how society grows, how culture develops, and how innovation happens. We also believe that copyright can often get in the way, usually without the copyright-holder’s intention. That’s why we created the Creative Commons licenses.
But measuring the size of the commons has always been a challenge. There’s no sign-up to use a CC license, and no central repository or catalog of CC-licensed works. So it’s impossible to say precisely how many licensed works there are, how many people are using Creative Commons licenses, where those people are located, or how they’re using them.
With this report, we’re taking a big step toward better measuring the size of the commons. We’re also sharing all of the data and methodologies that we used to find these numbers, and making a commitment to hone and update these findings in the months and years to come. We’re also telling the stories of events from 2014 that have impacted the size, usability, and relevance of the commons.
The size of the commons
Sharing is winning. In 2015, we’ll pass one billion Creative Commons–licensed works.
We’ve supplemented Google’s data with that of several websites that each have over a million CC-licensed works but aren’t reflected in Google’s data (see notes).
We’re also able to track usage data for the CC license badges. We found over 27 million license badges served in a single day. That’s even more amazing when you consider that that’s just a subset of all CC-licensed content: it covers only sites that hotlink our badges directly.
Even if we had access to unlimited data about how and where CC licenses are used, it would still be very difficult to establish a single number for all Creative Commons–licensed works. Where do we draw the line between one work and another? Every time a piece of content is reused on the internet, should it be counted again?
Since Google’s numbers are intentionally conservative—and since there’s more variation in how licensors mark CC-licensed works than a search can account for—all of the numbers in this report should be considered lowbound estimates.
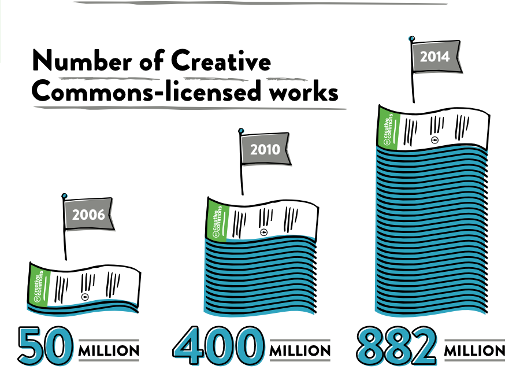
Today, there are over 882 million pieces of CC-licensed (or CC0) content on the web. Roughly 56% of that content is shared under CC tools whose terms allow both adaptations and commercial use (we commonly refer to those as free culture licenses).
In 2010, about 40% of CC-licensed works were under free culture licenses. The increase since then reflects the growing diversity in how and where CC licenses are used; we think it also speaks to a license user base that’s discovered the value and power in sharing work more openly, including national governments and major foundations.
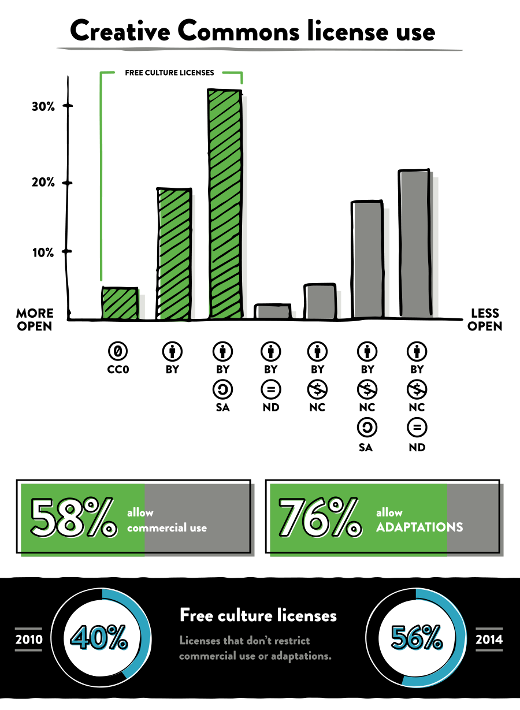
It’s also striking to note that a full 76% of works counted allow adaptations, and 58% allow commercial use.
License breakdown
- CC0: 4%
- CC BY: 19%
- CC BY-SA: 33%
- CC BY-ND: 2%
- CC BY-NC: 4%
- CC BY-NC-SA: 16%
- CC BY-NC-ND: 22%
This is an excerpt from the State of the Commons report from Creative Commons. For the full contents, see the report on the Creative Commons website.





1 Comment