Observability-driven development (ODD) is being recognized as "necessary" for complex, microservice-based architectures. Charity Majors coined the term and has written about it in several articles, including Observability: A Manifesto. She explains the term in this quote:
Do you bake observability right into your code as you're writing it? The best engineers do a form of "observability-driven-development" — they understand their software as they write it, include instrumentation when they ship it, then check it regularly to make sure it looks as expected. You can't just tack this on after the fact, "when it's done".
OpenTelemetry provides the plumbing
The OpenTelemetry project has the industry backing to be the 'plumbing' for enabling observability across distributed applications. The OpenTelemetry project is second only to Kubernetes when measuring the size of its contributor community among Cloud Native Computing Foundation (CNCF) projects, and was formed when OpenTracing and OpenCensus projects merged in 2019. Since then, almost all of the major players in the industry have announced their support for OpenTelemetry.
OpenTelemetry covers three observability signals—logs, metrics, and distributed traces. It standardizes the approach to instrumenting your code, collecting the data, and exporting it to a backend system where the analyses can occur and the information can be stored. By standardizing the 'plumbing' to gather these metrics, you can now be assured that you don't have to change the instrumentation embedded in your code when switching from one vendor to another, or deciding to take the analysis and storage in-house with an open source solution such as OpenSearch. Vendors fully support OpenTelemetry as it removes the onerous task of enabling instrumentation across every programming language, every tool, every database, every message bus— and across each version of these languages. An open source approach with OpenTelemetry benefits all!
Bridging the gap with Tracetest
So you want to do ODD, and you have a standard of how to instrument the code with OpenTelemetry. Now you just need a tool to bridge the gap and help you develop and test your distributed application with OpenTelemetry. This is why my team is building Tracetest, an open source tool to enable the development and testing of your distributed microservice application. It's agnostic to the development language used or the backend OpenTelemetry data source that is chosen.
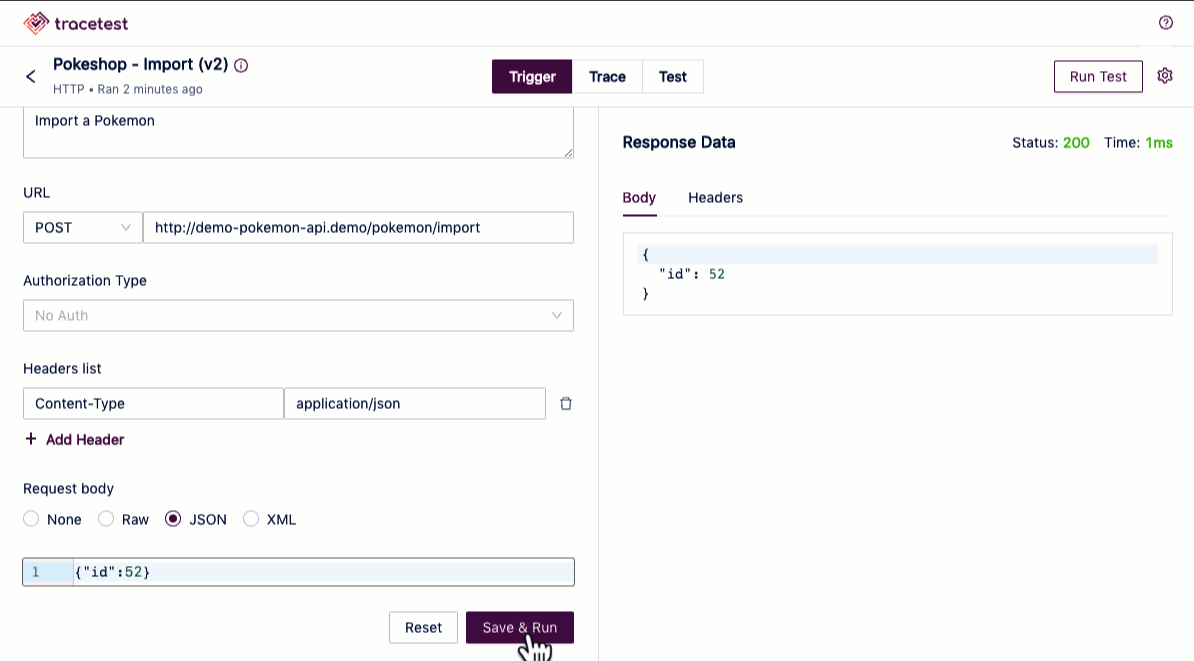
For years, developers have utilized tools such as Postman, ReadyAPI, or Insomnia to trigger their code, view the response, and create tests against the response. Tracetest extends this old concept to support the modern, observability-driven development needs of teams. Traces are front and center in the tool. Tracetest empowers you to trigger your code to execute, view both the response from that code and the OpenTelemetry trace, and to build tests based on both the response and the data contained in the trace.

(Ken Hamric, CC BY-SA 4.0)
Tracetest: Trigger, trace, and test
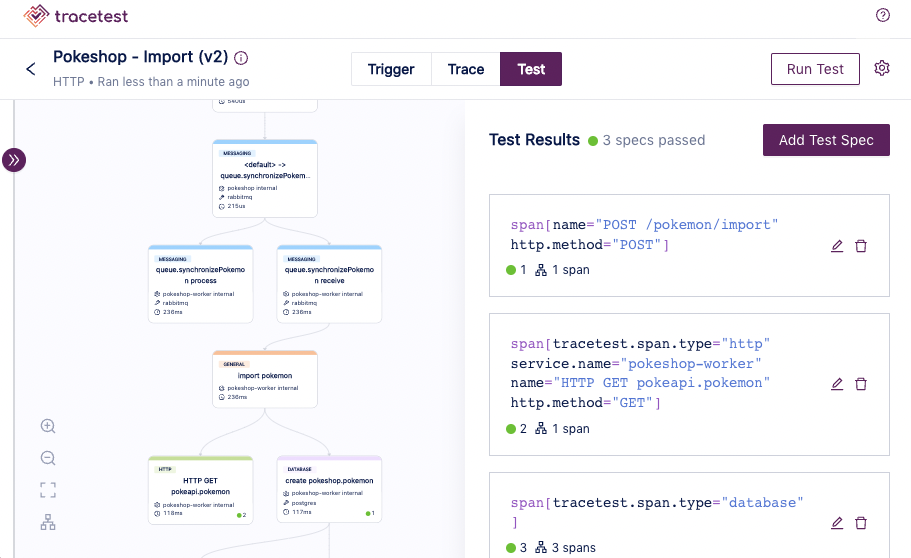
How does Tracetest work? First, you define a triggering transaction. This can be a REST or gRPC call. The tool executes this trigger and shows the developer the full response returned. This enables an interactive process of altering the underlying code and executing the trigger to check the response. Second, Tracetest integrates with your existing OpenTelemetry infrastructure to pull in the trace generated by the execution of the trigger, and shows you the full details of the trace. Spans, attributes, and timing are all visible. The developer can adjust their code and add manual instrumentation, re-execute the trigger, and see the results of their changes to the trace directly in the tool. Lastly, Tracetest allows you to build tests based on both the response of the transaction and the trace data in a technique known as trace-based testing.
[ Related read: What you need to know about automation testing in CI/CD ]
What is trace-based testing?
Trace-based testing is a new approach to an old problem. How do you enable integration tests to be written against complex systems? Typically, the old approach involved adding lots of complexity into your test so it had visibility into what was occurring in the system. The test would need a trigger, but it would also need to do extra work to access information contained throughout the system. It would need a database connection and authentication information, ability to monitor the message bus, and even additional instrumentation added to the code to enable the test. In contrast, Trace-based testing removes all the complexity. It can do this because of one simple fact—you have already fully instrumented your code with OpenTelemetry. By leveraging the data contained in the traces produced by the application under the test, Tracetest can make assertions against both the response data and the trace data. Examples of questions that can be asked include:
-
Did the response to the gRPC call have a 0 status code and was the response message correct?
-
Did both downstream microservices pull the message off the message queue?
-
When calling an external system as part of the process—does it return a status code of 200?
-
Did all my database queries execute in less than 250ms?

(Ken Hamric, CC BY-SA 4.0)
By combining the ability to exercise your code, view the response and trace returned, and then build tests based on both sets of data, Tracetest provides a tool to enable you to do observability-driven development with OpenTelemetry.
Try Tracetest
If you're ready to get started, download Tracetest and try it out. It's open source, so you can contribute to the code and help shape the future of trace-based testing with Tracetest!


Comments are closed.