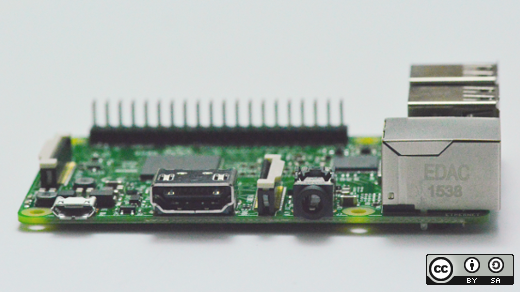
I was lucky enough to get a Raspberry Pi 2B with a 7-inch display for Christmas last year. I immediately had a plan for how to use it: I would make a home dashboard to show some useful information that is readable from around the living room.
- Current temperature and weather forecast in my area
- Next buses due at the local bus stops
- The news headlines
- The Tube status
- My fuzzed location (e.g., at work, traveling)
How to get started
I decided to write the dashboard in Python 3 and use the flask framework because I wanted to build up my Python 3 skills. I also wanted to be able to play with NFC (Near Field Communication) tags and see what they could do.
The concept behind the use of NFC tags is that it allows you to place tags in various locations, touch your phone on them, and use the NFC reader app update my dashboard at home. You need a phone that has NFC enabled (my Nexus 4 does).
I programmed the tags to launch an HTTP GET request to the endpoint running on my OpenShift application. This GET request has a few uses; most importantly, to send a signal for my fuzzed location or to provide feedback information, such as how many coffees I've had from Pret on any given day.
How it works
Here's a little diagram that explains:
- /coffeecount/plusone: This increments the coffee count (in MongoDB), which is readable via another endpoint with a simple get request. The MongoDB collection is wiped every 24 hours overnight.
- /location/one /location/two, etc.: This sets the fuzzed location, which is also stored in MongoDB and retrievable via another endpoint.
https://opensource.com/sites/default/files/nfc_tagging_process.png" title="NFC tagging process" typeof="foaf:Image" width="700">
Hardware
Here are the pieces of hardware I needed for my project:
- Raspberry Pi 2B, 7-inch official Pi display, Wi-Fi adapter, and Pi power supply
- Cheap NFC tags [NTAG213], which are available from Amazon
- An NFC-capable phone with an appropriate Android version, to run the software
Software and services
The APIs and data services that I chose for my information sources are all free of charge to use, as long as you abide by the limits and rules, of course.
For the reading and writing the NFC tags: NFC Tools – Pro Edition for Android, which is a cheap, handy application that allows you to program and reprogram actions onto your NFC tags, including HTTP GET and POST requests.
For the weather forecast: Met Office's weather API.
For my status information:
- My Raspberry Pi running Raspbian Wheezy, a simple Python requests and flask app for polling the APIs and displaying the information on the screen.
- A Python and MongoDB app running on the Red Hat OpenShift platform (the free tier is available to anyone for use), which allows me to send and retrieve my information from a web endpoint from my phone.
For the travel information:
- TfL (Transport for London) Tube Status API
- TfL Bus Status API (using local bus stop IDs to get arrival Times)
For the news headlines:
- The BBC's RSS feed
Using OpenShift
OpenShift offers a free tier that is a bit like a container service that can run up to three simple apps (plus MonogoDB, etc.) This level isn't really suitable for production-type applications, of course, as the instance goes to sleep after a period of disuse.
To get your application up and running, create an OpenShift account and follow the simple instructions, which will tell you how to configure keys, app name, etc. You then need to install the SDK on your local machine, write your code, and push it up to the OpenShift server on the Internet. OpenShift will then take the code dependencies (e.g., MonogDB) and start the process. Of course, if you want the project to be accessible via HTTP, you have to define a web server (e.g., a flask web app).
It was pretty pain-free for me to develop on the platform once I got over the initial issue of debugging. At first, my code worked locally but not in OpenShift, but this debugging solution solved that difficulty.
My application running in OpenShift is quite simple. It's a Python 3 app using flask and MongoDB, and by now you've seen how most of it works. It's an authenticated endpoint that receives the GET requests from my phone and increments values and alters values based on the target endpoint.
Display dashboard
This screenshot shows the result, and as you can see it's pretty low resolution because the Raspberry Pi screen is 800 x 480. It's not very pretty, but I like it.
https://opensource.com/sites/default/files/dashboard_screen.png" title="Pi Dashboard" typeof="foaf:Image" width="700">
For my next project, I would like to make a little space in my drywall and fit the Raspberry Pi display right in there—but with water, electricity, drills, and pain, maybe someday.
If you have comments, questions or feedback please don't hesitate to get in touch.


1 Comment