In a microservices environment, the service owner writes the code—and increasingly is called to keep the service(s) they wrote up and running. We very fittingly call that service ops. To me, the service ops idea is a subset of the appops moniker I subscribe to and advocate for.
Now, what does that look like from a practical perspective?

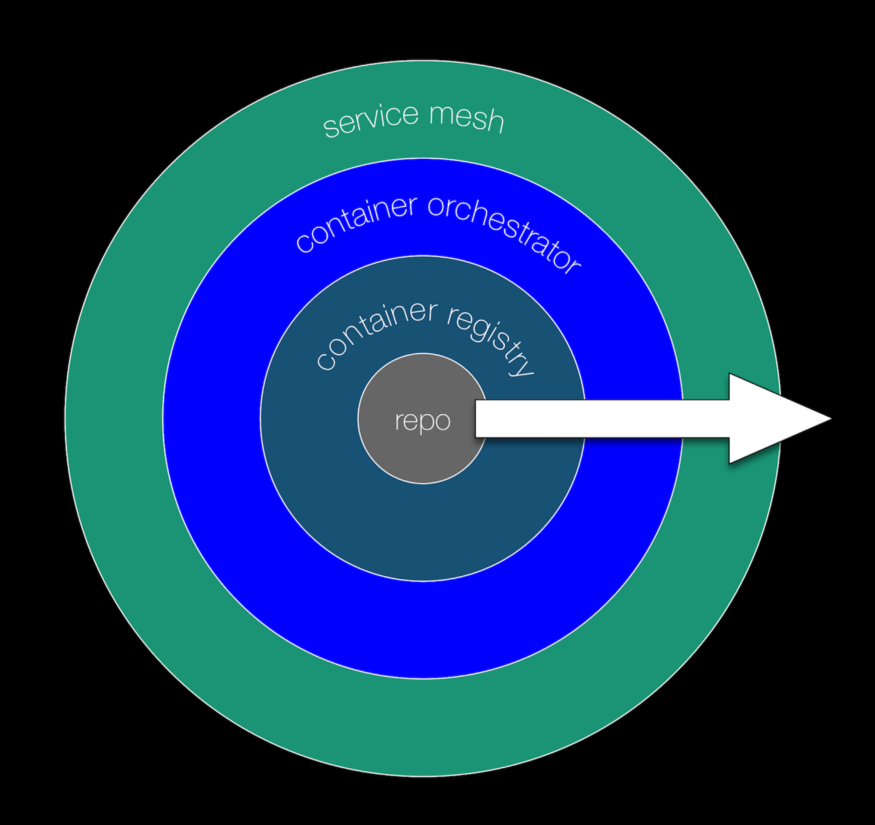
The cloud-native appops maturity model.
With the cloud-native appops maturity model in mind, you start by ensuring all your code and configuration are in a repo (usually Git). Then you put all of your container images in a secure, private container registry (such as Quay). You make sure you have a proper CI/CD pipeline in place that produces your container images in a reproducible manner. Also, you're likely using Kubernetes, the de-facto industry standard for orchestrating containers.
But once you start to experience pain points when running your containerized microservices, you begin asking yourself questions like:
- How can I identify which microservices (both HTTP and gRPC services) are behaving badly?
- Which service in a call chain is the slowest? What errors do I see on the wire?
- How should I troubleshoot or optimize a certain request path across a number of microservices?
Meet Linkerd 2.0
Linkerd 2.0 helps you at this stage of your evolution. It is built with the Unix philosophy in mind. That is, it doesn’t aim to do everything and more, but (or because of this?) it’s really good at what it does: focus on core service mesh responsibilities, including system-wide telemetry, security, and reliability.

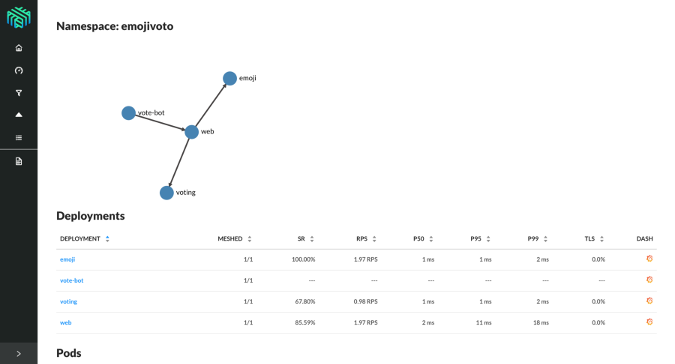
Linkerd 2.0 dashboard showing details of a microservices app.
Here's what's in the box:
- A self-contained, so-called service sidecar design augmenting services
- A zero-config installation process and no need to change your app code
- Preconfigured Grafana dashboards as well as integrated monitoring via Prometheus
- Automatic Transport Layer Security (TLS) management including certificate generation and distribution
- A usable web UI and powerful command-line interface (CLI)

The Linkerd 2.0 CLI showing service-level communication stats across all namespaces.
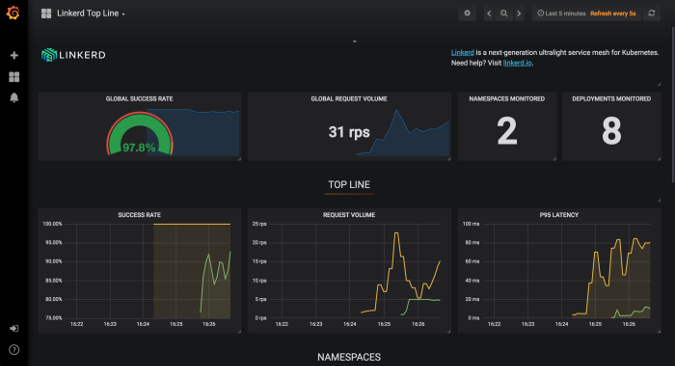
For policy management, observability, etc., Linkerd 2.0 integrates super smoothly with other tools, such as Prometheus and Grafana. In fact, they're embedded out of the box for the dashboard.

A pre-built Grafana dashboard (included in Linkerd 2.0).
A demo says more than 1,000 words
The following demo shows an interaction with Linkerd 2.0 after completing setup in less than five minutes. It shows how to debug an app consisting of a couple of microservices with Linkerd 2.0, using the linkerd command-line tool.
Next steps
Linkerd 2.0 is a super useful tool that comes with a minimal footprint and enables service ops to work faster and more effectively.
I am excited about its possibilities and look forward to seeing what the community behind this CNCF project will deliver on top of what it already offers. I'm confident that support for things like distributed tracing, layer 7 policy enforcement, and traffic shaping (think A/B testing, etc.) are high on the list of things to come. I can't wait to see Linkerd 2.0 continue to grow sustainably and healthy.
For more information
Alrighty, where should you go from here? I have some suggestions:
- Join the discussion around Linkerd 2.0. Leave feedback, suggest a feature, or ask for help in the forum by joining the Linkerd Slack community (on the #linkerd2 channel).
- Try out Linkerd 2.0 via a Katacoda scenario I put together. It's accessible through your favorite browser, and you'll learn how to install and use Linkerd 2.0 in less than 10 minutes.
- Check out the Linkerd 2.0 hands-on demo materials from my Velocity NYC talk in October.
This was originally published on Hacker Noon and is reprinted with permission.


Comments are closed.