

Forensic analysis of a Linux disk image is often part of incident response to determine if a breach has occurred. Linux forensics is a different and fascinating world compared to Microsoft Windows forensics. In this article, I will analyze a disk image from a potentially compromised Linux system in order to determine the who, what, when, where, why, and how of the incident and create event and filesystem timelines. Finally, I will extract artifacts of interest from the disk image.
In this tutorial, we will use some new tools and some old tools in creative, new ways to perform a forensic analysis of a disk image.
The scenario
Premiere Fabrication Engineering (PFE) suspects there has been an incident or compromise involving the company's main server named pfe1. They believe the server may have been involved in an incident and may have been compromised sometime between the first of March and the last of March. They have engaged my services as a forensic examiner to investigate if the server was compromised and involved in an incident. The investigation will determine the who, what, when, where, why, and how behind the possible compromise. Additionally, PFE has requested my recommendations for further security measures for their servers.
The disk image
To conduct the forensic analysis of the server, I ask PFE to send me a forensic disk image of pfe1 on a USB drive. They agree and say, "the USB is in the mail." The USB drive arrives, and I start to examine its contents. To conduct the forensic analysis, I use a virtual machine (VM) running the SANS SIFT distribution. The SIFT Workstation is a group of free and open source incident response and forensic tools designed to perform detailed digital forensic examinations in a variety of settings. SIFT has a wide array of forensic tools, and if it doesn't have a tool I want, I can install one without much difficulty since it is an Ubuntu-based distribution.
Upon examination, I find the USB doesn't contain a disk image, rather copies of the VMware ESX host files, which are VMDK files from PFE's hybrid cloud. This was not what I was expecting. I have several options:
- I can contact PFE and be more explicit about what I am expecting from them. Early in an engagement like this, it might not be the best thing to do.
- I can load the VMDK files into a virtualization tool such as VMPlayer and run it as a live VM using its native Linux programs to perform forensic analysis. There are at least three reasons not to do this. First, timestamps on files and file contents will be altered when running the VMDK files as a live system. Second, since the server is thought to be compromised, every file and program of the VMDK filesystems must be considered compromised. Third, using the native programs on a compromised system to do a forensic analysis may have unforeseen consequences.
- To analyze the VMDK files, I could use the libvmdk-utils package that contains tools to access data stored in VMDK files.
- However, a better approach is to convert the VMDK file format into RAW format. This will make it easier to run the different tools in the SIFT distribution on the files in the disk image.
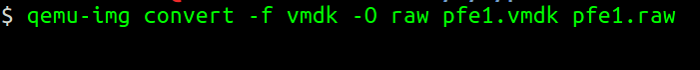
To convert from VMDK to RAW format, I use the qemu-img utility, which allows creating, converting, and modifying images offline. The following figure shows the command to convert the VMDK format into a RAW format.
opensource.com
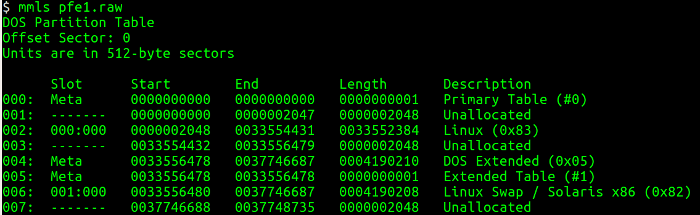
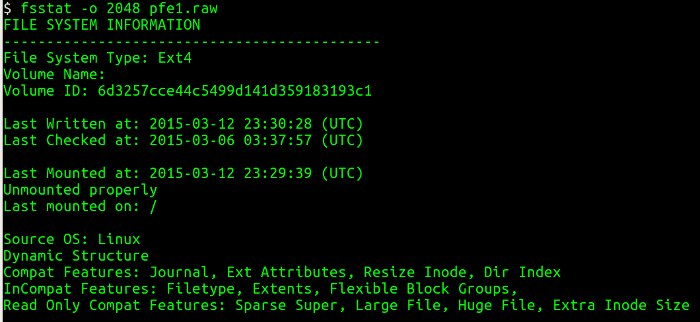
Next, I need to list the partition table from the disk image and obtain information about where each partition starts (sectors) using the mmls utility. This utility displays the layout of the partitions in a volume system, including partition tables and disk labels. Then I use the starting sector and query the details associated with the filesystem using the fsstat utility, which displays the details associated with a filesystem. The figures below show the mmls and fsstat commands in operation.
opensource.com
I learn several interesting things from the mmls output: A Linux primary partition starts at sector 2048 and is approximately 8 gigabytes in size. A DOS partition, probably the boot partition, is approximately 8 megabytes in size. Finally, there is a swap partition of approximately 8 gigabytes.
opensource.com
Running fsstat tells me many useful things about the partition: the type of filesystem, the last time data was written to the filesystem, whether the filesystem was cleanly unmounted, and where the filesystem was mounted.
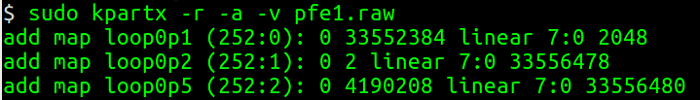
I'm ready to mount the partition and start the analysis. To do this, I need to read the partition tables on the raw image specified and create device maps over partition segments detected. I could do this by hand with the information from mmls and fsstat—or I could use kpartx to do it for me.
opensource.com
I use options to create read-only mapping (-r), add partition mapping (-a), and give verbose output (-v). The loop0p1 is the name of a device file under /dev/mapper I can use to access the partition. To mount it, I run:
$ mount -o ro -o loop=/dev/mapper/loop0p1 pf1.raw /mntNote that I'm mounting the partition as read-only (-o ro) to prevent accidental contamination.
After mounting the disk, I start my forensic analysis and investigation by creating a timeline. Some forensic examiners don't believe in creating a timeline. Instead, once they have a mounted partition, they creep through the filesystem looking for artifacts that might be relevant to the investigation. I label these forensic examiners "creepers." While this is one way to forensically investigate, it is far from repeatable, is prone to error, and may miss valuable evidence.
I believe creating a timeline is a crucial step because it includes useful information about files that were modified, accessed, changed, and created in a human-readable format, known as MAC (modified, accessed, changed) time evidence. This activity helps identify the specific time and order an event took place.
Notes about Linux filesystems
Linux filesystems like ext2 and ext3 don't have timestamps for a file's creation/birthtime. The creation timestamp was introduced in ext4. The book Forensic Discovery (1st edition) by Dan Farmer and Wietse Venema outlines the different timestamps.
- Last modification time: For directories, this is the last time an entry was added, renamed, or removed. For other file types, it's the last time the file was written to.
- Last access (read) time: For directories, this is the last time it was searched. For other file types, it's the last time the file was read.
- Last status change: Examples of status changes are change of owner, change of access permission, change of hard link count, or an explicit change of any of the MAC times.
- Deletion time: ext2 and ext3 record the time a file was deleted in the
dtimetimestamp, but not all tools support it. - Creation time: ext4fs records the time the file was created in the
crtimetimestamp, but not all tools support it.
The different timestamps are stored in the metadata contained in the inodes. Inodes are similar to the MFT entry number in the Windows world. One way to read the file metadata on a Linux system is to first get the inode number using the command ls -i file then use istat against the partition device and specify the inode number. This will show you the different metadata attributes, including the timestamps, the file size, owner's group and user id, permissions, and the blocks that contain the actual data.
Creating the super timeline
My next step is to create a super timeline using log2timeline/plaso. Plaso is a Python-based rewrite of the Perl-based log2timeline tool initially created by Kristinn Gudjonsson and enhanced by others. It's easy to make a super timeline with log2timeline, but interpretation is difficult. The latest version of the plaso engine can parse the ext4 as well as different type of artifacts, such as syslog messages, audit, utmp, and others.
To create the super timeline, I launch log2timeline against the mounted disk folder and use the Linux parsers. This process takes some time; when it finishes I have a timeline with the different artifacts in plaso database format, then I can use psort.py to convert the plaso database into any number of different output formats. To see the output formats that psort.py supports, enter psort -o list. I used psort.py to create an Excel-formatted super timeline. The figure below outlines the steps to perform this operation.

opensource.com
(Note: extraneous lines removed from images)
opensource.com
I import the super timeline into a spreadsheet program to make viewing, sorting, and searching easier. While you can view a super timeline in a spreadsheet program, it's easier to work with it in a real database such as MySQL or Elasticsearch. I create a second super timeline and dispatch it directly to an Elasticsearch instance from psort.py. Once the super timeline has been indexed by Elasticsearch, I can visualize and analyze the data with Kibana.
opensource.com
Investigating with Elasticsearch/Kibana
As Master Sergeant Farrell said, "Through readiness and discipline, we are masters of our fate." During the analysis, it pays to be patient and meticulous and avoid being a creeper. One thing that helps a super timeline analysis is to have an idea of when the incident may have happened. In this case (pun intended), the client says the incident may have happened in March. I still consider the possibility the client is incorrect about the timeframe. Armed with this information, I start reducing the super timeline's timeframe and narrowing it down. I'm looking for artifacts of interest that have a "temporal proximity" with the supposed date of the incident. The goal is to recreate what happened based on different artifacts.
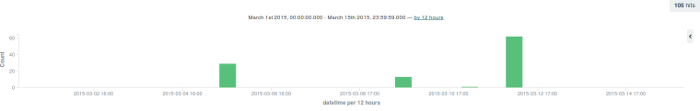
To narrow the scope of the super timeline, I use the Elasticsearch/Kibana instance I set up. With Kibana, I can set up any number of intricate dashboards to display and correlate forensic events of interest, but I want to avoid this level of complexity. Instead, I select indexes of interest for display and create a bar graph of activity by date:
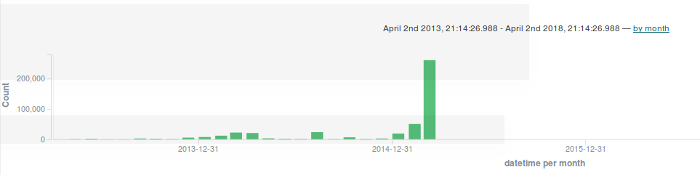
opensource.com
The next step is to expand the large bar at the end of the chart:
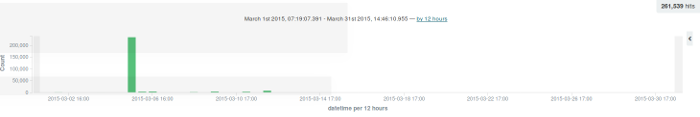
opensource.com
There is a large bar on 05-Mar. I expand that bar out to see the activity on that particular date:
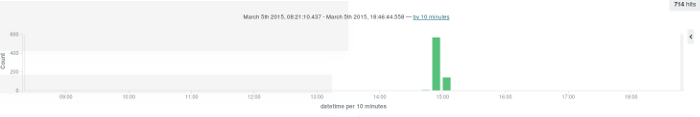
opensource.com
Looking at the logfile activity from the super timeline, I see this activity was from a software install/upgrade. There is very little to be found in this area of activity.
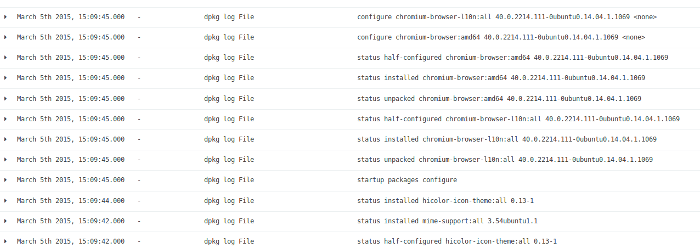
opensource.com
I go back to Kibana to see the last set of activities on the system and find this in the logs:
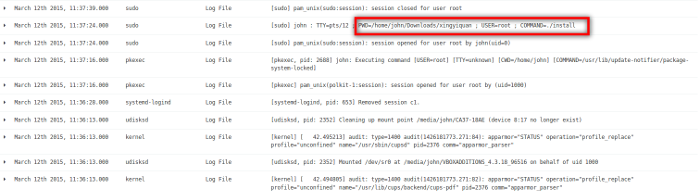
opensource.com
One of the last activities on the system was user john installed a program from a directory named xingyiquan. Xing Yi Quan is a style of Chinese martial arts similar to Kung Fu and Tai Chi Quan. It seems odd that user john would install a martial arts program on a company server from his own user account. I use Kibana's search capability to find other instances of xingyiquan in the logfiles. I found three periods of activity surrounding the string xingyiquan on 05-Mar, 09-Mar, and 12-Mar.
opensource.com
Next, I look at the log entries for these days. I start with 05-Mar and find evidence of an internet search using the Firefox browser and the Google search engine for a rootkit named xingyiquan. The Google search found the existence of such a rootkit on packetstormsecurity.com. Then, the browser went to packetstormsecurity.com and downloaded a file named xingyiquan.tar.gz from that site into user john's download directory.
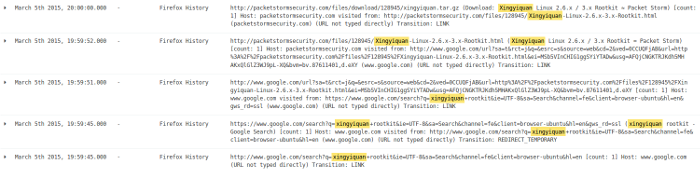
opensource.com
Although it appears user john went to google.com to search for the rootkit and then to packetstormsecurity.com to download the rootkit, these log entries do not indicate the user behind the search and download. I need to look further into this.
The Firefox browser keeps its history information in an SQLite database under the .mozilla directory in a user's home directory (i.e., user john) in a file named places.sqlite. To view the information in the database, I use a program called sqlitebrowser. It's a GUI application that allows a user to drill down into an SQLite database and view the records stored there. I launched sqlitebrowser and imported places.sqlite from the .mozilla directory under user john's home directory. The results are shown below.
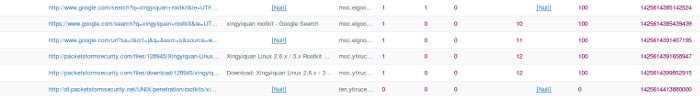
opensource.com
The number in the far-right column is the timestamp for the activity on the left. As a test of congruence, I converted the timestamp 1425614413880000 to human time and got March 5, 2015, 8:00:13.880 PM. This matches closely with the time March 5th, 2015, 20:00:00.000 from Kibana. We can say with reasonable certainty that user john searched for a rootkit named xingyiquan and downloaded a file from packetstormsecurity.com named xingyiquan.tar.gz to user john's download directory.
Investigating with MySQL
At this point, I decide to import the super timeline into a MySQL database to gain greater flexibility in searching and manipulating data than Elasticsearch/Kibana alone allows.
Building the xingyiquan rootkit
I load the super timeline I created from the plaso database into a MySQL database. From working with Elasticsearch/Kibana, I know that user john downloaded the rootkit xingyiquan.tar.gz from packetstormsecurity.com to the download directory. Here is evidence of the download activity from the MySQL timeline database:
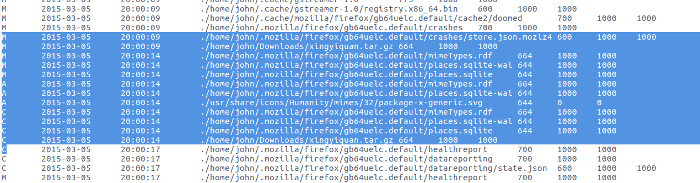
opensource.com
Shortly after the rootkit was downloaded, the source from the tar.gz archive was extracted.
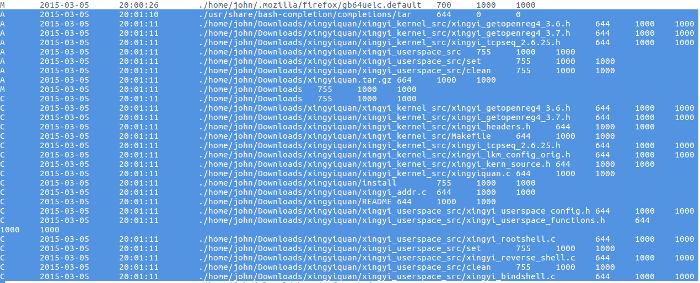
opensource.com
Nothing was done with the rootkit until 09-Mar, when the bad actor read the README file for the rootkit with the More program, then compiled and installed the rootkit.
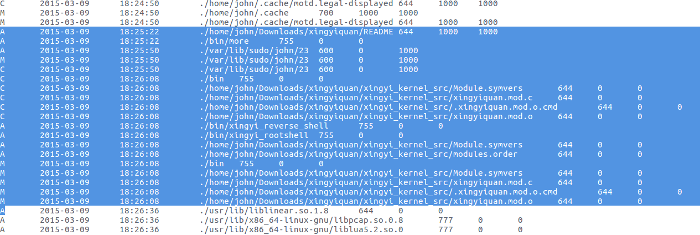
opensource.com
Command histories
I load histories of all the users on pfe1 that have bash command histories into a table in the MySQL database. Once the histories are loaded, I can easily display them using a query like:
select * from histories order by recno;To get a history for a specific user, I use a query like:
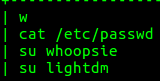
select historyCommand from histories where historyFilename like '%<username>%' order by recno;I find several interesting commands from user john's bash history. Namely, user john created the johnn account, deleted it, created it again, copied /bin/true to /bin/false, gave passwords to the whoopsie and lightdm accounts, copied /bin/bash to /bin/false, edited the password and group files, moved the user johnn's home directory from johnn to .johnn, (making it a hidden directory), changed the password file using sed after looking up how to use
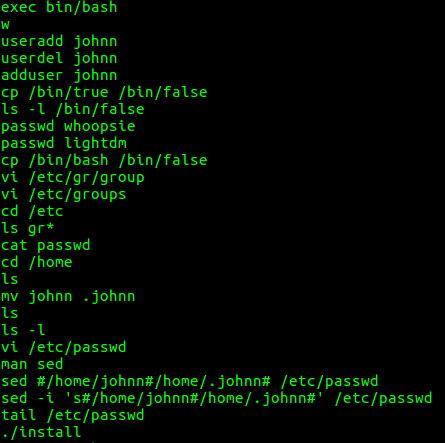
opensource.com
Next, I look at the bash command history for user johnn. It showed no unusual activity.
opensource.com
Noting that user john copied /bin/bash to /bin/false, I test whether this was true by checking the sizes of these files and getting an MD5 hash of the files. As shown below, the file sizes and the MD5 hashes are the same. Thus, the files are the same.
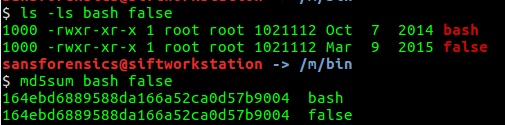
opensource.com
Investigating successful and failed logins
To answer part of the "when" question, I load the logfiles containing data on logins, logouts, system startups, and shutdowns into a table in the MySQL database. Using a simple query like:
select * from logins order by startI find the following activity:
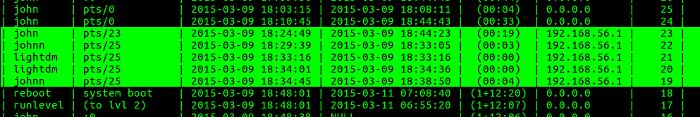
opensource.com
From this figure, I see that user john logged into pfe1 from IP address 192.168.56.1. Five minutes later, user johnn logged into pfe1 from the same IP address. Two logins by user lightdm followed four minutes later and another one minute later, then user johnn logged in less than one minute later. Then pfe1 was rebooted.
Looking at unsuccessful logins, I find this activity:
opensource.com
Again, user lightdm attempted to log into pfe1 from IP address 192.168.56.1. In light of bogus accounts logging into pfe1, one of my recommendations to PFE will be to check the system with IP address 192.168.56.1 for evidence of compromise.
Investigating logfiles
This analysis of successful and failed logins provides valuable information about when events occurred. I turn my attention to investigating the logfiles on pfe1, particularly the authentication and authorization activity in /var/log/auth*. I load all the logfiles on pfe1 into a MySQL database table and use a query like:
select logentry from logs where logfilename like '%auth%' order by recno;and save that to a file. I open that file with my favorite editor and search for 192.168.56.1. Following is a section of the activity:
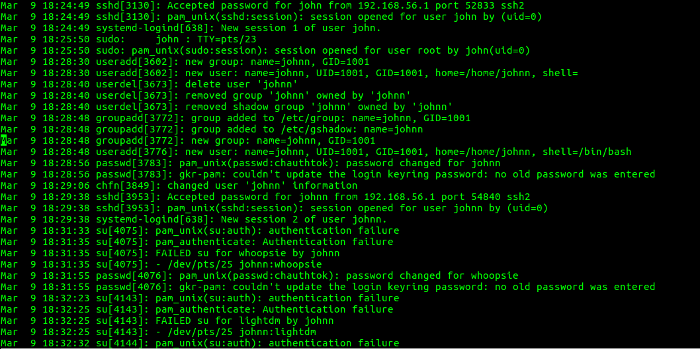
opensource.com
This section shows that user john logged in from IP address 192.168.56.1 and created the johnn account, removed the johnn account, and created it again. Then, user johnn logged into pfe1 from IP address 192.168.56.1. Next, user johnn attempted to become user whoopsie with an su command, which failed. Then, the password for user whoopsie was changed. User johnn next attempted to become user lightdm with an su command, which also failed. This correlates with the activity shown in Figures 21 and 22.
Conclusions from my investigation
- User john searched for, downloaded, compiled, and installed a rootkit named xingyiquan onto the server pfe1. The xingyiquan rootkit hides processes, files, directories, processes, and network connections; adds backdoors; and more.
- User john created, deleted, and recreated another account on pfe1 named johnn. User john made the home directory of user johnn a hidden file to obscure the existence of this user account.
- User john copied the file
/bin/trueover/bin/falseand then/bin/bashover/bin/falseto facilitate the logins of system accounts not normally used for interactive logins. - User john created passwords for the system accounts whoopsie and lightdm. These accounts normally do not have passwords.
- The user account johnn was successfully logged into and user johnn unsuccessfully attempted to become users whoopsie and lightdm.
- Server pfe1 has been seriously compromised.
My recommendations to PFE
- Rebuild server pfe1 from the original distribution and apply all relevant patches to the system before returning it to service.
- Set up a centralized syslog server and have all systems in the PFE hybrid cloud log to the centralized syslog server and to local logs to consolidate log data and prevent tampering with system logs. Use a security information and event monitoring (SIEM) product to facilitate security event review and correlation.
- Implement
bashcommand timestamps on all company servers. - Enable audit logging of the root account on all PFE servers and direct the audit logs to the centralized syslog server where they can be correlated with other log information.
- Investigate the system with IP address
192.168.56.1for breaches and compromises, as it was used as a pivot point in the compromise of pfe1.
If you have used forensics to analyze your Linux filesystem for compromises, please share your tips and recommendations in the comments.
Gary Smith will be speaking at LinuxFest Northwest this year. See program highlights or register to attend.


7 Comments