It's been said that "Software is eating the world," and every company will eventually become a "software company." Since open source is becoming the mainstream path for developing software, the way companies manage their relationships with the open source projects they depend on will be crucial for their success.
An open source program office (OSPO) is a company's asset to manage such relationships, and more and more companies are setting them up. Even the Linux Foundation has a project called the TODO Group "to collaborate on practices, tools, and other ways to run successful and effective open source projects and programs".
Uber is a member of the TODO Group and its OSPO is working with Bitergia Analytics (where I work) to examine Uber's open source community engagement and solve questions about its project activity and performance, two important factors for decision making. Bitergia is one of the core contributors to Community Health Analytics for Open Source Software (CHAOSS), a Linux Foundation project that focuses on:
- Establishing standard, implementation-agnostic metrics for measuring community activity, contributions, and health
- Producing integrated open source software for analyzing software community development
- Building reproducible project health reports/containers
Questions to ask
Following are four of the questions Uber's OSPO is trying to solve with data.
1. Where are my contributors?
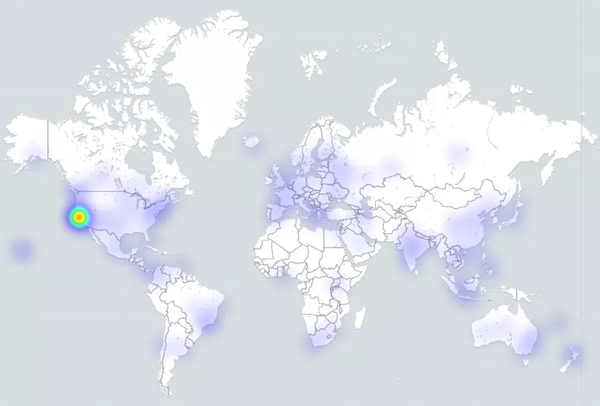
Since a large number of contributions to Uber's open source projects happen in GitHub, we can plot them geographically in a heat map.
But there are other ways to check a project's geographical diversity, especially when contributions come from tools that don't have geo-data information, like Git or mailing lists. In those cases, time zone data can be a valuable resource.
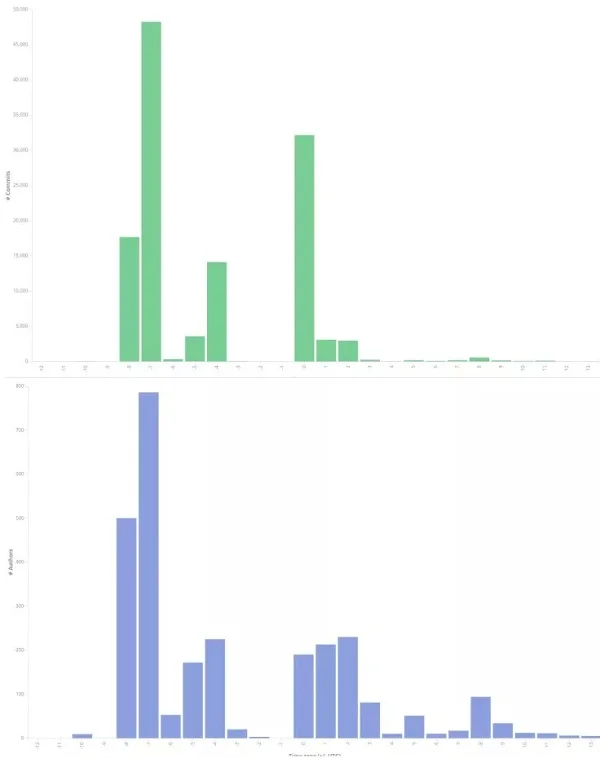
These charts clearly show that most contributions to Uber's open source software projects come from the US West Coast, but contributors are distributed worldwide.
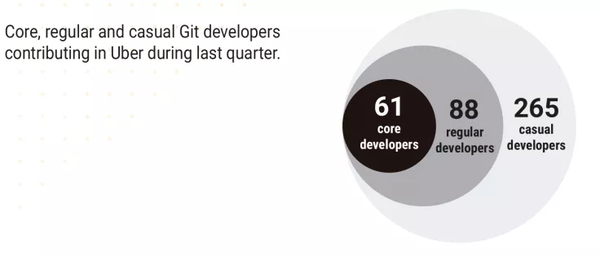
2. How many core, regular, and casual contributors are in my community?
Many people are familiar with the bus factor, but it can be hard to measure. One approach is to identify the core, regular, and casual project contributors based on their activity:
- Core contributors: Those who have made 80% of the contributions for a certain period of time
- Regular contributors: Those who have made 15% of the contributions for a certain period of time
- Casual contributors: Those who have made 5% of the contributions for a certain period of time
This method of targeting community members is called the onion analysis. Contributions can be commits, issues submitted, pull requests submitted, etc.
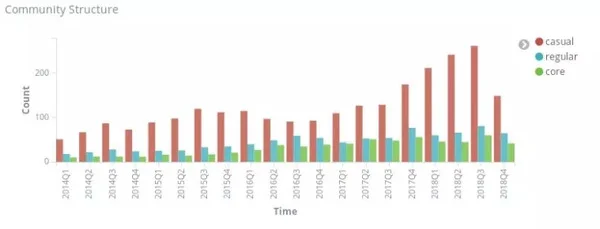
This chart shows the evolution, by quarter, of contributor types:
3. Is my community growing?
By tracking the number of active contributors and repositories, forums, mailing lists, etc. over a period of time, we can see the evolution of Uber's open source community. But we can go one step beyond this metric by also identifying how those developers collaborate.
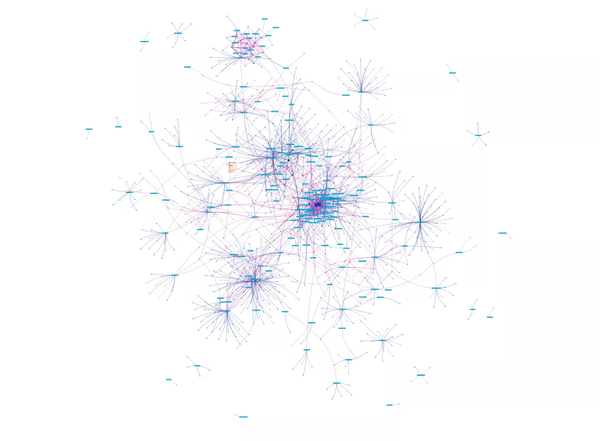
For example, comparing Uber's 2014–2015 projects and contributors network:
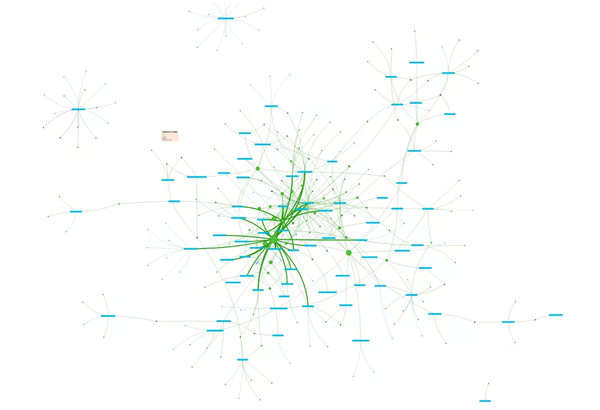
with its 2017–2018 network, we can visually check how rich and complex Uber's open source software ecosystem is becoming.
4. How am I dealing with external contributors?
Fair play is key for any open source community. How Uber deals with issues, questions, and code contributions from outside the company in its open source projects shows how welcoming it is, and this information helps Uber adjust policies to improve mentoring, documentation, etc.
For example, the median time to close issues from non-Uber employees during last year was four to five days, while it was almost nine days the year before.
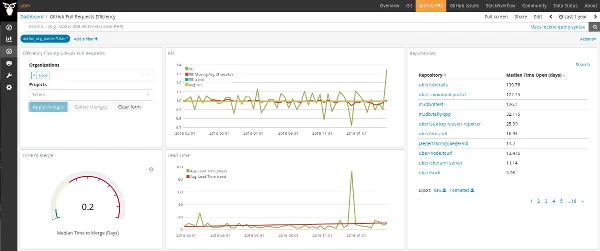
If we look at last year's GitHub pull requests, those submitted by Uber employees are closed in around five hours (median), while those from non-Uber employees are closed in almost a day. Is it good? It looks good to me, but it depends on Uber's OSPO goals and policies to decide if they want to improve it.
Next steps
All the charts and data in this post have been created with GrimoireLab, one of the CHAOSS tools, by analyzing all the projects managed by Uber's OSPO. There is a live dashboard available to play with the data. Since everything is based on free, open source software, you can build your own dashboard.
These projects are the ones Uber has released in GitHub, but are they the only ones the OSPO should be worried about? Definitely not, so Uber and Bitergia are working on extending these analyses to the entire set of open source projects where Uber is contributing.
Uber's Brian Hsieh and Bitergia's Manrique Lopez have presented Building a collaborative open source program at Uber at the 17th annual Southern California Linux Expo (SCaLE 17x) March 7-10 in Pasadena, Calif. and a similar talk in the Open Source Leadership Summit, March 12-14 in Half Moon Bay, Calif.


Comments are closed.