In my previous post, I walked Mac users through the steps they’ll take to install Elasticsearch, the world’s most popular enterprise search engine. (Here's a separate article for Linux users.) Its natural language processing power makes Elasticsearch excel at finding details within datasets. Once you’ve discovered the data you need, you can take it to the next level if you’ve installed Kibana as well.
Kibana is an open source data visualization plugin for Elasticsearch. Once you’ve found data in Elasticsearch, Kibana helps you put it into line charts, time series queries, geospatial maps, and more. This tool is ideal for data scientists who must present their research results, especially those working with open source data.
Installing Kibana
You’ll need to install Kibana separately from Elasticsearch. Since I installed Elasticsearch 7.1.1, I’ll install Kibana 1.1. It’s important to match versions so Kibana runs against an Elasticsearch node of the same version. (Kibana runs on node.js.)
Here are the steps I followed to install Kibana 7.1.1 for MacOS:
- Make sure Elasticsearch is downloaded and running. See the previous article for instructions if needed.
Note: At minimum, you’ll need to install Elasticsearch 1.4.4 or later before you can use Kibana. This is because you’ll need to give Kibana the URL for the Elasticsearch instance to connect to, along with the Elasticsearch indices you want to search. In general, it’s best to install the latest versions of both.
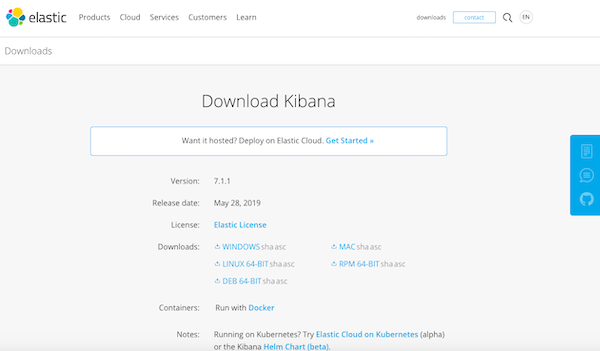
- Click here to download Kibana. You’ll see the webpage below, which prompts you to download Kibana for Mac in the top right-hand corner of the Downloads section:
- In your Downloads folder, open the .tar file to expand it. This action creates a folder with the same name (for example, kibana-7.1.1-darwin-x86_64).
- If you would prefer Kibana to live in another folder, move it now.
Double-check that Elasticsearch is running, and if not, launch it before continuing. (See the previous article if you need instructions.)
Opening the Kibana plugin
With Elasticsearch running, you can now launch Kibana. The process is similar to launching Elasticsearch:
- From your Mac’s Downloads folder (or the new folder if you moved Kibana), open the Kibana folder (i.e. ~Downloads/kibana-7.1.1-darwin-x86_64).
- Open the bin subfolder to enter that one.
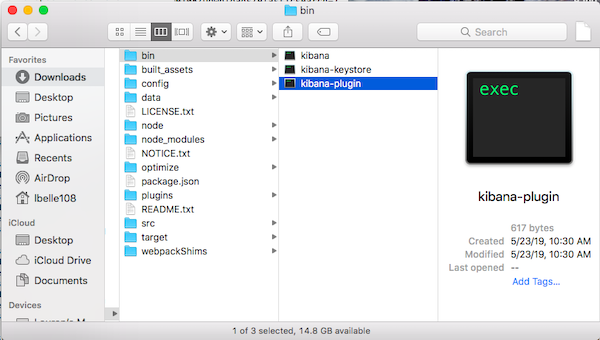
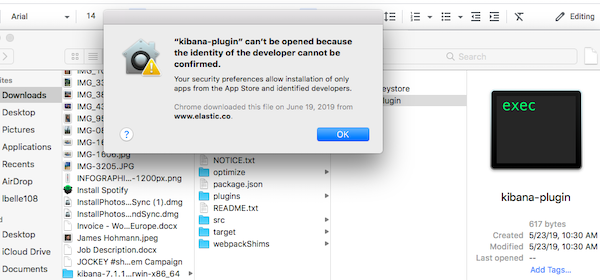
- Run kibana-plugin. You may run into the same security warning that came up in the previous article:
opensource.com
In general, if you get this warning, follow the instructions in that article to clear the warning and open Kibana. Note that if I try to open the plugin without Elasticsearch running in the terminal, I get this same security warning. To fix this, I open Elasticsearch and run it in the terminal as described in the previous article. Launching Elasticsearch with the GUI should open the terminal as well.
Then, I right-clicked on kibana-plugin and selected Open. This solution worked for me, but you might need to try a few times. Several people in my Elasticsearch meetup had some trouble opening Kibana on their devices.
Changing Kibana’s host and port numbers
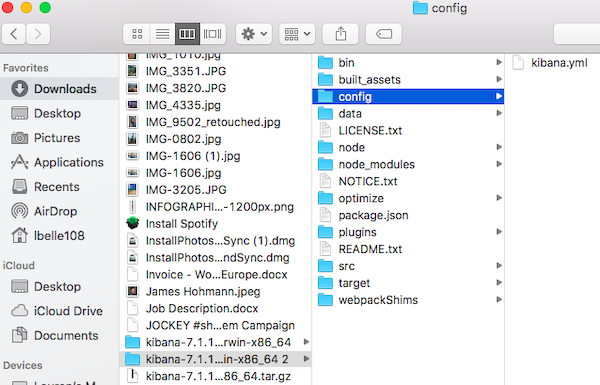
Kibana’s default settings configure it to run on localhost: 5601. You’ll need to update the file (in the case of this example) ~Downloads/kibana-7.1.1-darwin-x86_64/config/kibana.yml to change the host or port number before you run Kibana.
opensource.com
Here’s what the terminal looked like when my Elasticsearch meetup group configured Kibana so it would default to https://localhost:9200, which is the URL to use when querying your Elasticsearch instances:
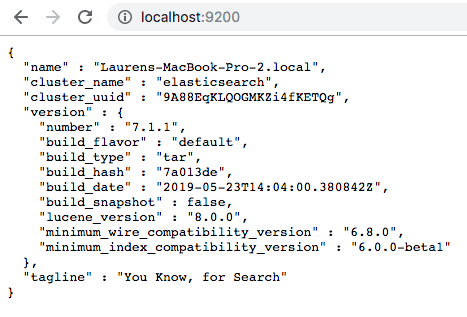
Running Kibana from the command line
Once you’ve opened the plugin, you can run Kibana from the command line or from the GUI. Here’s what the terminal looked like once it connected to Elasticsearch:
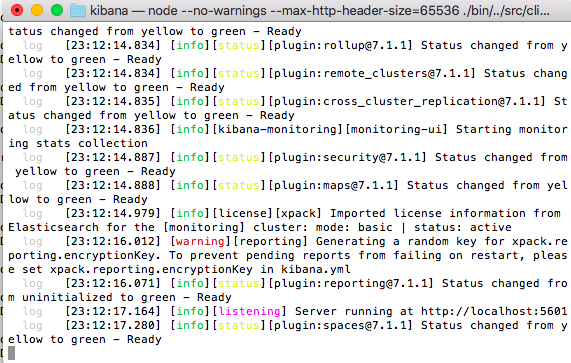
Like Elasticsearch, Kibana runs in the foreground by default. You can stop it by pressing Ctrl-C.
Wrapping up
Elasticsearch and Kibana are large packages that take up a fair amount of storage. With so many people downloading both packages at once, my fellow Elasticsearch meetup members and I had to wait an average of several minutes for both of them to download. This might have been due to poor WiFi and/or too many users at once, but keep this possibility in mind if the same thing happens to you.
After that, I couldn’t upload the JSON file we were using due to low storage on my laptop. I was able to follow the instructor’s visualizations, but couldn’t use Kibana myself in real time. So, before you download Elasticsearch and Kibana, make sure there’s enough room (at least a few gigabytes) on your device to upload and search files with these tools.
To learn more about Kibana, their user guide’s Introduction is ideal. (You can configure the guide based on which version of Kibana you’re using.) Their demo also shows you how to build a dashboard in minutes and then make your first deployment.
Have fun!


Comments are closed.