

The Internet of Things (IoT) and edge computing industries are developing quickly, and with it so does the scale of endpoints and the complexity of business logic. The more the IoT ecosystem grows, the more important it becomes to verify the availability and reliability of your platform. If you're delivering services, then testing your IoT system can help you find bottlenecks in performance, and help you plan ahead for scalability.
IoT can consist of any number of different devices using diverse protocols, strung together with complex integration architecture. This can make it challenging to design effective and meaningful tests for it. In this article, I demonstrate how to test an IoT platform using EMQX as an example of how to introduce performance test tools to verify and test platform-related quality indicators.
EMQX
EMQX is a scalable messaging (MQTT) broker used to connect IoT devices. It's open source, but because it's a broker you must have a working node to manage all the messaging traffic. You can accept its business source license (BSL) and gain 10 licenses to use the official EMQX cloud installation. Alternately, you can install and run EMQX on your own server.
Introduction to JMeter
JMeter is an open source software of the Apache Foundation. It mainly implements performance tests by simulating concurrent loads, a common performance testing method in the open source community. It mainly has the following advantages:
- Built-in support for multiple protocols, including TCP, HTTP, HTTPS, and more.
- Provides a flexible plug-in extension mechanism and supports third-party extensions of other protocols.
- Great community support.
Install JMeter
JMeter is written in Java, so you must install Java if it's not already installed. For Linux, macOS, and Windows, you can use Adoptium.net. On Linux, you may alternatively use SDKMan.
After installing Java, download JMeter, decompress it, and enter the bin subdirectory of the archive directory. Depending on your operating system, run jmeter (Linux and macOS) or jmeter.bat (Windows).
$ wget https://dlcdn.apache.org//jmeter/binaries/apache-jmeter-X.Y.tgz
$ tar xvf apache-jmeter*tgz
$ cd apache-jmeter-X.Y/bin
$ ./jmeter
JMeter's script editing interface is presented to you:
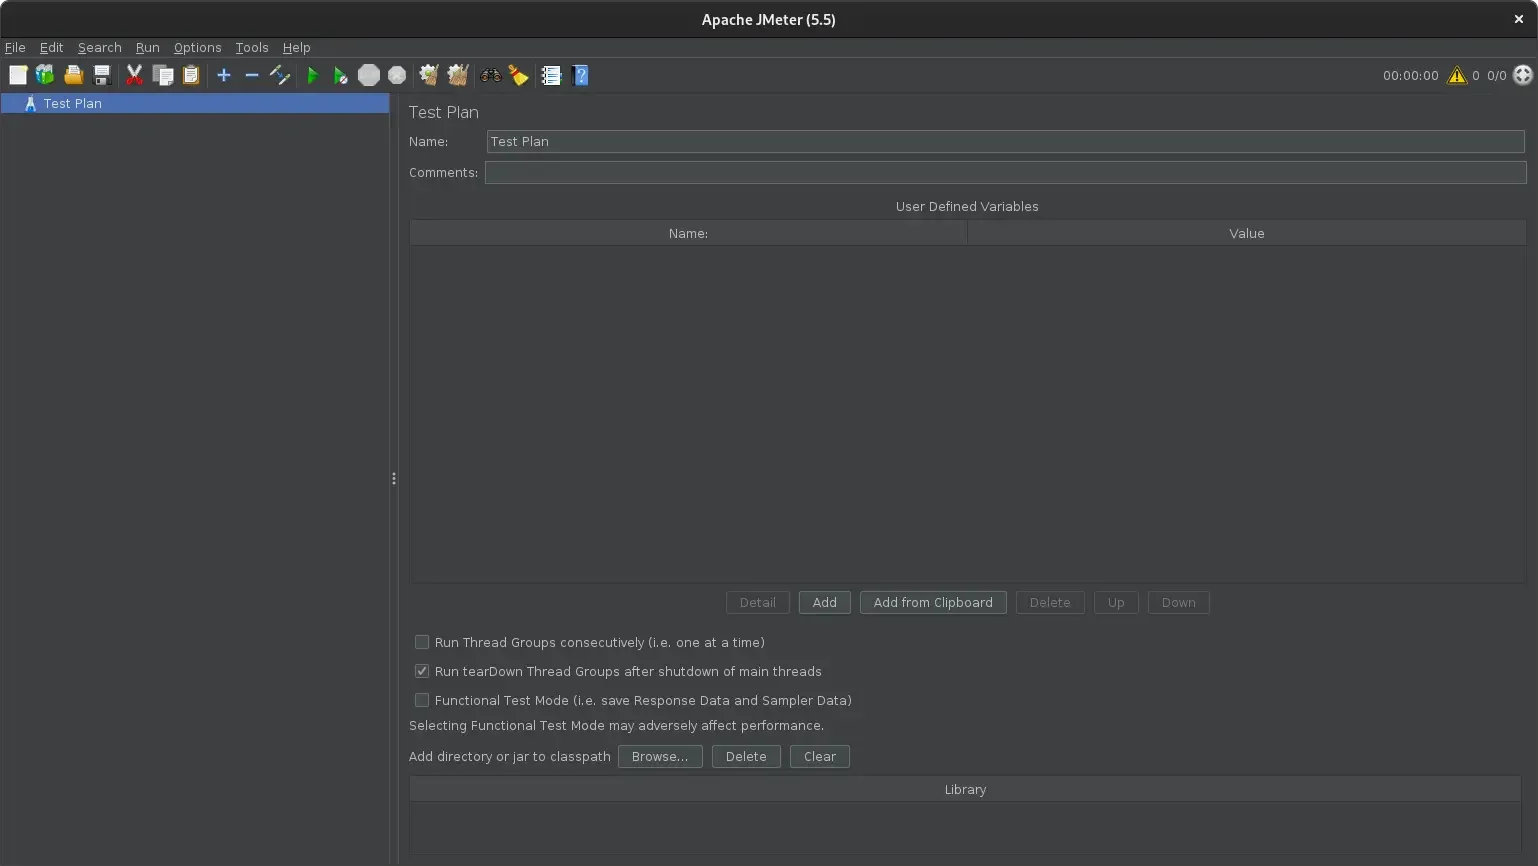
(Chongyuan Yin, CC BY-SA 4.0)
Your first JMeter test
Here's how to use JMeter to build and run a simple HTTP test case.
-
JMeter uses a single thread to simulate a user. A Thread Group refers to a virtual user group, and simulates access to the system being tested.
To add a virtual user group (Thread Group), right-click on Test plan > Add > Threads (Users) > Thread Group.
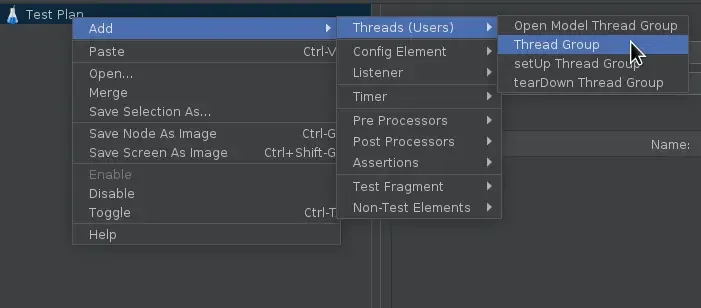
(Chongyuan Yin, CC BY-SA 4.0)
Number of Threads in Thread Properties can be used to configure the number of concurrent users in a virtual user group. The higher the value, the greater the amount of concurrency. Use Loop Count to configure how many tests each virtual user performs.
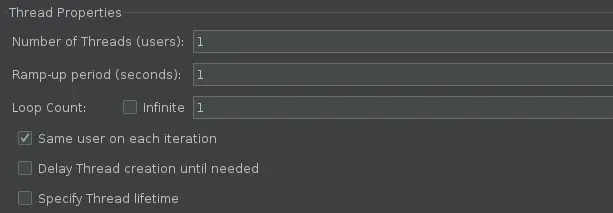
(Chongyuan Yin, CC BY-SA 4.0)
-
JMeter includes several example tests. Add the HTTP Request test with a right-click on Thread Group > Add > Sampler > HTTP Request.
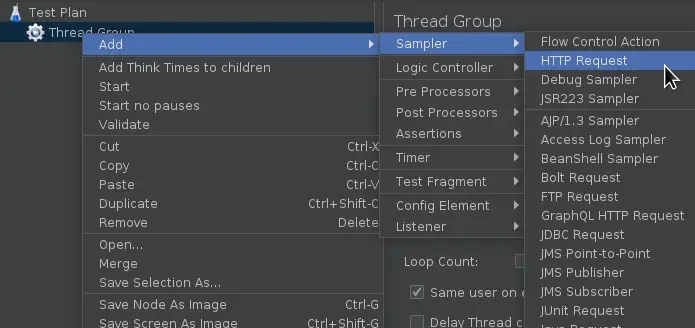
(Chongyuan Yin, CC BY-SA 4.0)
In the sample test script, use the default HTTP request settings to initiate an HTTP request to a website.
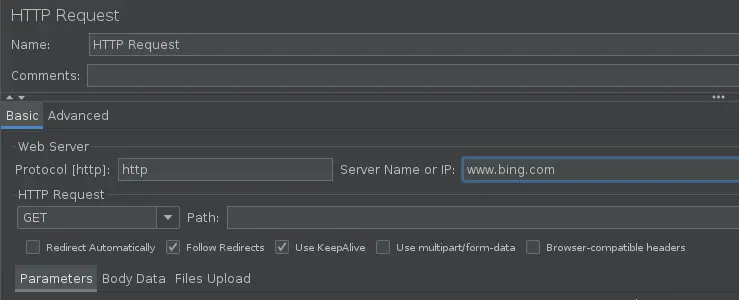
(Chongyuan Yin, CC BY-SA 4.0)
-
A result listener is not strictly necessary for the performance test, but it lets you see the test result. This can help facilitate debugging in the process of writing scripts. In this sample script, use View Result Tree to help view the response information of the request.
To add a result listener, right-click on Thread group > Add > Listener > View Results Tree.
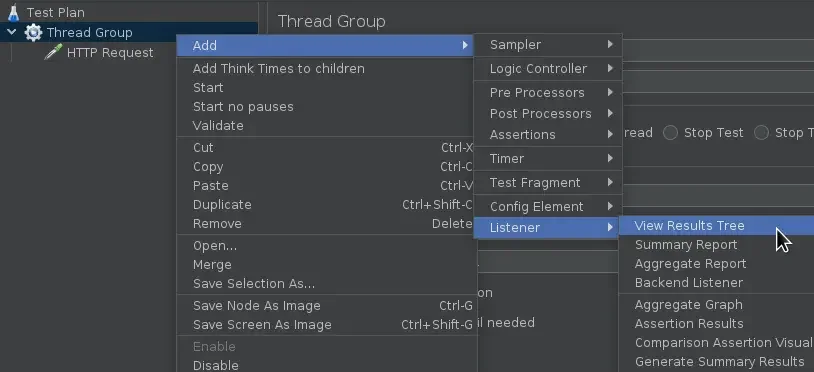
(Chongyuan Yin, CC BY-SA 4.0)
-
Time to run the test. After saving your test script, click the Start button in the top toolbar to run the test script. Because you're testing against a public website, use a low number (under 10) of threads and loop count. If you spam the site, you could find yourself blocked in the future!
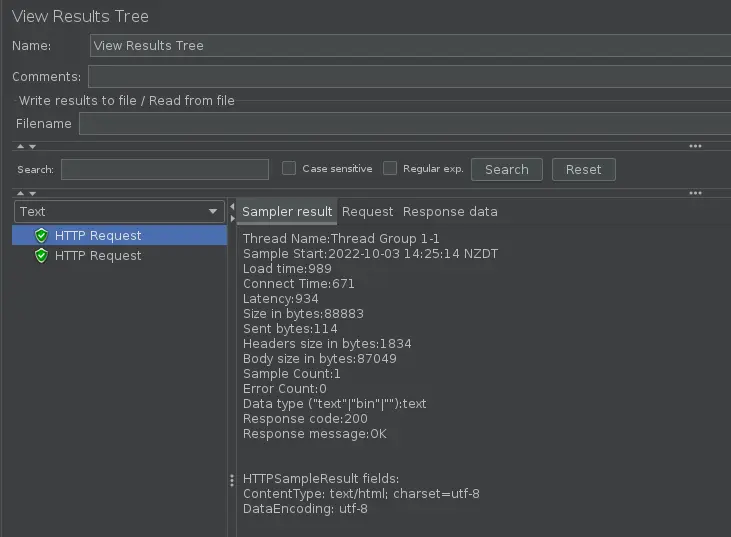
(Chongyuan Yin, CC BY-SA 4.0)
Test your IoT platform
You've completed a simple HTTP test script. You can draw inferences from this case and try other protocols. In the next article, I'll introduce other test components of JMeter in more detail, which you can use together to build complex test scenarios. For now, explore JMeter to see what you can test.


Comments are closed.