If you spent your high school years gazing at TI-80 series calculators but lost track of the device somewhere along the way, then you might sometimes yearn to relive those thrilling years of algebra and calculus. Somebody on the Linux KDE project must have felt that way, too, because one of the KDE Framework libraries, Analitza, provides syntax and widgets to enable you to perform advanced math functions with K apps like the graphing calculator KAlgebra.
Install KAlgebra on Linux
On Linux, you can install KAlgebra from your software repository. For example, on Fedora, Mageia, and similar:
$ sudo dnf install kalgebraOn Elementary, Linux Mint, and other Debian-based distributions:
$ sudo apt install kalgebraAlternately, you can install it as a flatpak.
Linux calculator
KAlgebra is, like many of the famous graphing calculators used in schools, both a scientific calculator and a 2D plotter. Unlike any of the graphing calculators I've ever used, it's also a 3D plotter. But before rushing into 3D space, start with some basic syntax.
When representing an equation in KAlgebra, you must do some minor translation of math symbols as they're often written by hand to how they're represented on a computer. For instance, to convert Fahrenheit degrees to Celsius, the equation is: (5÷9) × (n-32), where n is Fahrenheit. This is generally how equations and mathematical functions are expressed: they use special symbols like ÷ and × as well as variables like n, and then they identify what variable represents what kind of value. You may or may not know the meaning of every special math symbol, but as long as you know that a special symbol has a specific meaning, then you can look it up. In the temperature conversion example, the symbols are pretty common, so you probably already know that ÷ represents division and × represents multiplication.
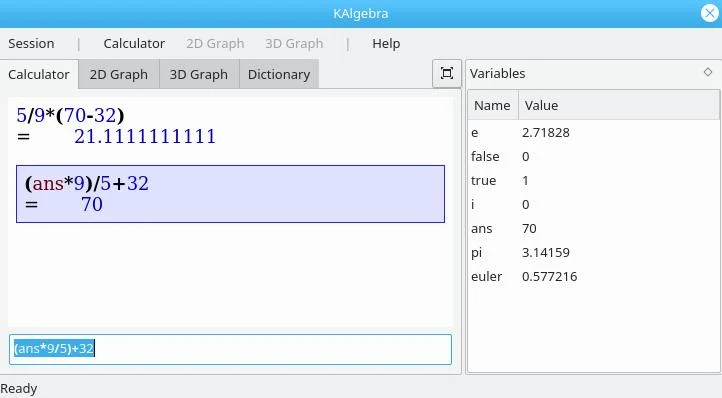
In KAlgebra, as in most programming languages, division is represented by a forward slash and multiplication by an asterisk, so the equation to, for example, convert 70° Fahrenheit is (5/9)*(70-32).
There are also special functions for common math operations in KAlgebra, and when you type any letter into KAlgebra, a tooltip provides potential auto-completion for available functions. Another way to write the equation for temperature conversion in KAlgerbra is to use the times function: times(5/9, 70-32).
As you complete math problems, established variables are listed in the right column of the calculator, including the ans value, which is updated with the answer to the completed equation. In theory, then, you should be able to reverse the conversion and derive a Fahrenheit temperature from ans.
(Seth Kenlon, CC BY-SA 4.0)
Graphing calculator
Numbers are fun, but they really get fun when they're used to draw shapes. The visualization of 2D space on a graph is an important skill to develop for all kinds of disciplines, not the least of which is computer programming.
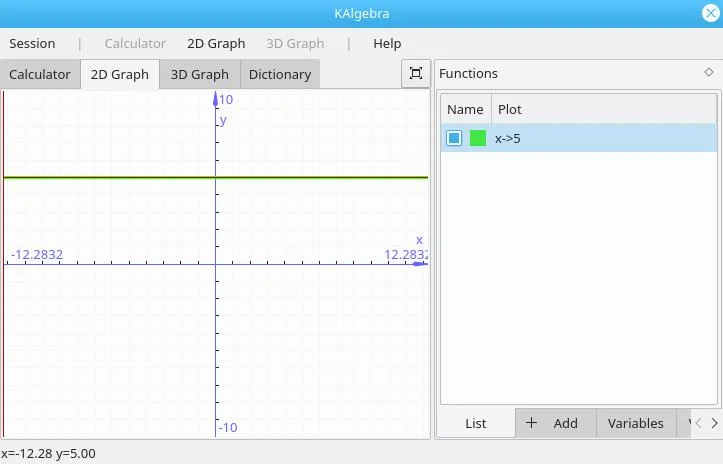
To draw a line on a graph, you must set a horizontal value (the x-axis) or a vertical value (the y-axis) or both. A valid equation for a straight line in common mathematical notation is just x=5. This produces a straight horizontal line 5 points above the 0 origin point of the graph. However, in KAlgebra you must make it explicit that you want to set just the x value with the notation x->5.
(Seth Kenlon, CC BY-SA 4.0)
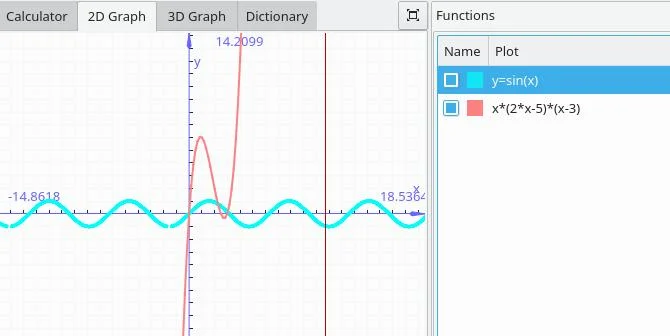
Other than that, graphing is as straightforward as it is elsewhere. You can write complex equations, and you can use special functions, like sin.
(Seth Kenlon, CC BY-SA 4.0)
3D graph on Linux
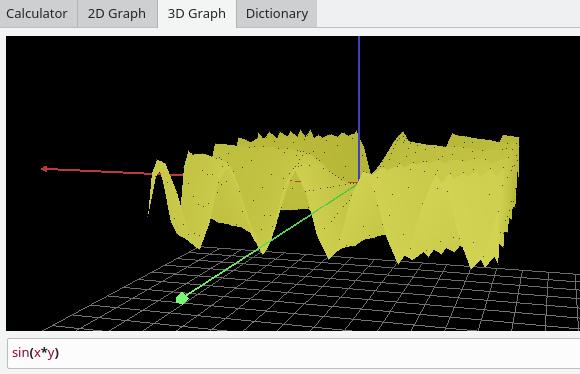
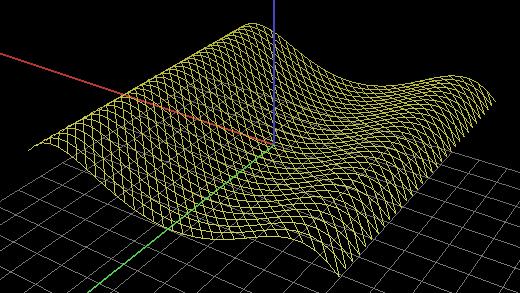
By the time you get to the 3D graph tab, you likely have a good understanding of the syntax of KAlgebra, and you've also exceeded my mathematical knowledge. I learned everything I know about cartesian graphs from electronics and synthesis, so the most fun I've had with the 3D graph is visualizing a sine wave as a 3D object:
(Seth Kenlon, CC BY-SA 4.0)
The difference between the 3D graph and the 2D graph (aside from 1 dimension) is that you can only have one plot in the 3D graph, so choose your equations wisely.
Can math be fun?
It turns out that yes, math can be fun, and the answer is a good graphing calculator. As I've been working my way through math lessons to make up for some pretty dismal math grades in my past, I find myself wishing that calculators had been encouraged. I'm finding KAlgebra to be a very useful tool for not only solving arbitrary problems, but also for understanding the syntax of equations, and the purpose of functions. Whatever your relationship with mathematics, take out your KAlgebra calculator and run some numbers. It's actually really fun.



Comments are closed.