

When we first open sourced Spark, we aimed to provide a simple API for distributed data processing in general-purpose programming languages (Java, Python, Scala). Spark enabled distributed data processing through functional transformations on distributed collections of data (RDDs). This was an incredibly powerful API—tasks that used to take thousands of lines of code to express could be reduced to dozens.
As Spark continues to grow, we want to enable wider audiences beyond big data engineers to leverage the power of distributed processing. The new DataFrame API was created with this goal in mind. This API is inspired by data frames in R and Python (Pandas), but designed from the ground up to support modern big data and data science applications. As an extension to the existing RDD API, DataFrames feature:
- Ability to scale from kilobytes of data on a single laptop to petabytes on a large cluster
- Support for a wide array of data formats and storage systems
- State-of-the-art optimization and code generation through the Spark SQL Catalyst optimizer
- Seamless integration with all big data tooling and infrastructure via Spark
- APIs for Python, Java, Scala, and R (in development via SparkR)
For new users familiar with data frames in other programming languages, this API should make them feel at home. For existing Spark users, this extended API will make Spark easier to program, and at the same time improve performance through intelligent optimizations and code-generation.
What are DataFrames?
In Spark, a DataFrame is a distributed collection of data organized into named columns. It is conceptually equivalent to a table in a relational database or a data frame in R/Python, but with richer optimizations under the hood. DataFrames can be constructed from a wide array of sources such as: structured data files, tables in Hive, external databases, or existing RDDs.
The following example shows how to construct DataFrames in Python. A similar API is available in Scala and Java.
# Constructs a DataFrame from the users table in Hive. users = context.table( users )
# from JSON files in S3 logs = context.load( s3n://path/to/data.json , json )
How can one use DataFrames?
Once built, DataFrames provide a domain-specific language for distributed data manipulation. Here is an example of using DataFrames to manipulate the demographic data of a large population of users:
# Create a new DataFrame that contains "young users" only
 young = users.filter(users.age < 21)
# Alternatively, using Pandas-like syntax
 young = users[users.age < 21]
# Increment everybody's age by 1
 young.select(young.name, young.age + 1)
# Count the number of young users by gender
 young.groupBy( gender ).count()
# Join young users with another DataFrame called logs
 young.join(logs, logs.userId == users.userId, left_outer )
You can also incorporate SQL while working with DataFrames, using Spark SQL. This example counts the number of users in the young DataFrame.
young.registerTempTable( young )
 context.sql( SELECT count(*) FROM young )
In Python, you can also convert freely between Pandas DataFrame and Spark DataFrame:
# Convert Spark DataFrame to Pandas
 pandas_df = young.toPandas()
# Create a Spark DataFrame from Pandas spark_df = context.createDataFrame(pandas_df)
Similar to RDDs, DataFrames are evaluated lazily. That is to say, computation only happens when an action (e.g. display result, save output) is required. This allows their executions to be optimized by applying techniques such as predicate push-downs and bytecode generation, as explained later in the section "Under the hood: Intelligent optimization and code generation." All DataFrame operations are also automatically parallelized and distributed on clusters.
Supported data formats and sources
Modern applications often need to collect and analyze data from a variety of sources. Out of the box, DataFrame supports reading data from the most popular formats, including JSON files, Parquet files, and Hive tables. It can read from local file systems, distributed file systems (HDFS), cloud storage (S3), and external relational database systems via JDBC. In addition, through Spark SQL's external data sources API, DataFrames can be extended to support any third-party data formats or sources. Existing third-party extensions already include Avro, CSV, ElasticSearch, and Cassandra.
DataFrames' support for data sources enables applications to easily combine data from disparate sources (known as federated query processing in database systems). For example, the following code snippet joins a site's textual traffic log stored in S3 with a PostgreSQL database to count the number of times each user has visited the site.
users = context.jdbc( jdbc:postgresql:production , users )
logs = context.load( /path/to/traffic.log )
logs.join(users, logs.userId == users.userId, left_outer ) \
.groupBy( userId ).agg({ * : count })
Application: Advanced analytics and machine learning
Data scientists are employing increasingly sophisticated techniques that go beyond joins and aggregations. To support this, DataFrames can be used directly in MLlib's machine learning pipeline API. In addition, programs can run arbitrarily complex user functions on DataFrames.
Most common advanced analytics tasks can be specified using the new pipeline API in MLlib. For example, the following code creates a simple text classification pipeline consisting of a tokenizer, a hashing term frequency feature extractor, and logistic regression.
tokenizer = Tokenizer(inputCol= text , outputCol= words )
hashingTF = HashingTF(inputCol= words , outputCol= features )
lr = LogisticRegression(maxIter=10, regParam=0.01)
pipeline = Pipeline(stages=[tokenizer, hashingTF, lr])
Once the pipeline is setup, we can use it to train on a DataFrame directly:
df = context.load( /path/to/data )
model = pipeline.fit(df)
For more complicated tasks beyond what the machine learning pipeline API provides, applications can also apply arbitrarily complex functions on a DataFrame, which can also be manipulated using Spark's existing RDD API. The following snippet performs a word count, the "hello world" of big data, on the bio column of a DataFrame.
df = context.load( /path/to/people.json )
 # RDD-style methods such as map, flatMap are available on DataFrames
 # Split the bio text into multiple words.
 words = df.select( bio ).flatMap(lambda row: row.bio.split( ))
 # Create a new DataFrame to count the number of words words_df = words.map(lambda w: Row(word=w, cnt=1)).toDF()
 word_counts = words_df.groupBy( word ).sum()
Under the hood: Intelligent optimization and code generation
Unlike the eagerly evaluated data frames in R and Python, DataFrames in Spark have their execution automatically optimized by a query optimizer. Before any computation on a DataFrame starts, the Catalyst optimizer compiles the operations that were used to build the DataFrame into a physical plan for execution. Because the optimizer understands the semantics of operations and structure of the data, it can make intelligent decisions to speed up computation.
At a high level, there are two kinds of optimizations. First, Catalyst applies logical optimizations such as predicate pushdown. The optimizer can push filter predicates down into the data source, enabling the physical execution to skip irrelevant data. In the case of Parquet files, entire blocks can be skipped and comparisons on strings can be turned into cheaper integer comparisons via dictionary encoding. In the case of relational databases, predicates are pushed down into the external databases to reduce the amount of data traffic.
Second, Catalyst compiles operations into physical plans for execution and generates JVM bytecodes for those plans that is often more optimized than hand-written code. For example, it can choose intelligently between broadcast joins and shuffle joins to reduce network traffic. It can also perform lower level optimizations such as eliminating expensive object allocations and reducing virtual function calls. As a result, we expect performance improvements for existing Spark programs when they migrate to DataFrames.
Since the optimizer generates JVM bytecode for execution, Python users will experience the same high performance as Scala and Java users.
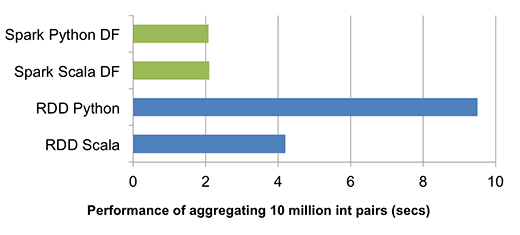
The above chart compares the runtime performance of running group-by-aggregation on 10 million integer pairs on a single machine (source code). Since both Scala and Python DataFrame operations are compiled into JVM bytecode for execution, there is little difference between the two languages, and both outperform the vanilla Python RDD variant by a factor of five and Scala RDD variant by a factor of two.
DataFrames were inspired by previous distributed data frame efforts, including Adatao's DDF and Ayasdi's BigDF. However, the main difference from these projects is that DataFrames go through the Catalyst optimizer, enabling optimized execution similar to that of Spark SQL queries. As we improve the Catalyst optimizer, the engine also becomes smarter, making applications faster with each new release of Spark.
Our data science team at Databricks has been using this new DataFrame API on our internal data pipelines. It has brought performance improvements to our Spark programs while making them more concise and easier to understand. We are very excited about it and believe it will make big data processing more accessible to a wider array of users.
This API is part of Spark 1.3. You can learn more about it from a presentation I gave last month (slidedeck, video). Please try it out. We look forward to your feedback.


1 Comment