Optimizing your Java code requires an understanding of how the different elements in Java interact, and how it interacts with the operating system that is it running on. Use these five tips and resources to start learning how to analyze and optimize your code.
Before we get to the good stuff, you might be concerned about licensing. Java is owned by Oracle, and is under Oracle's BCL license, which is not a free/open source license. Even so, Oracle Java is part of many open source projects. OpenJDK is the free software implementation of the Java platform, licensed under GPL v2. (See Free Java implementations on Wikipedia for more information.)
Getting started
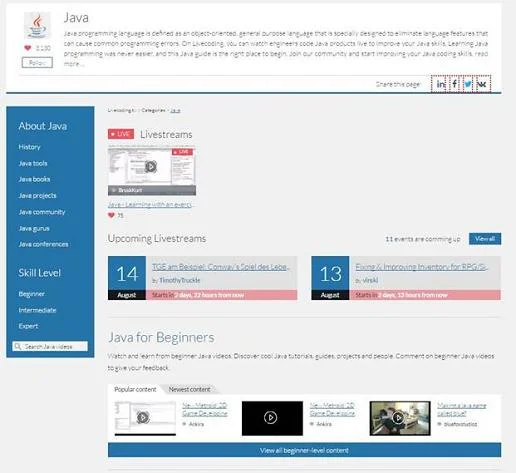
Performance optimization depends on multiple factors including garbage collection, virtual machines, and underlying operating system (OS) settings. There are multiple tools that a developer can use for analysis and optimization purposes, and you can learn about some of them by reading Java Tools for Source Code Optimization and Analysis. If you are struggling with terminology and Java fundamentals, check out the Livecoding Java category page for livestreams, archived videos, and other useful information.

"It depends"
It is necessary to understand that no two applications can have the same optimizations, and that there is no sure-shot path to optimize Java applications. It is all about using the best practices and sticking to a proper way of handling performance optimization methodology. To be really at the top of performance optimization you, as a Java developer, need to have proper understanding of the Java Virtual Machine (JVM) and the underlying operating system:
- JVM and underlying OS: The Java Virtual Machine is the home of any Java application. Read the JVM internals guide to learn more about JVM internals, and operating system differences.
- JVM Distribution Model: The Java Distribution Model deals with multiple JVM instances for your application. The distribution model improves app performance as it gets more resources to work with. You can go forward with two approaches. The first approach is to run multiple JVMs on a single server with a heap size of either 2GB or 8GB. The second approach is to run one JVM on multiple servers. Choosing the right approach depends on multiple factors including availability and responsiveness.
- JVM Architecture: Choosing the right JVM architecture is important for performance. You can go with either a 64-bit JVM machine or a 32-bit JVM machine. Generally, the 32-bit JVM performs better than its 64-bit counterpart. The only reason you should choose the 64-bit JVM is if you require a heap size greater than 3GB.
With the basic ideas of performance optimization and its elements clear, we will now focus on tricks that help you optimize your Java application.
1. Tune garbage collection (GC)
It is very hard to find the exact performance of your application due to the garbage collection complexity. However, if you really want to optimize your application, you need to handle garbage collection accordingly. The general rule is to change GC settings and perform profiling at the same time.
Once you are satisfied with the results, you can stop the process and move towards other forms of optimization. Ensure that in addition to average transaction time you are also looking out for outliers. The outliers are the real culprits when it comes to the slowing down of the Java application, and are hard to find.
Additionally, you need to understand the impact of performance hits during application runtime. A slowdown every single week can be ignored, whereas a slowdown every single database transaction can be a costly affair. Choose your optimization path accordingly, and optimize the application according to the workload.
2. Get the right GC algorithm to work for you
Let's get more into the GC optimization. After all, it is the meat of the whole optimization problem at hand. Currently, there are four Java garbage collector algorithms from which you can choose. Each of the algorithms cater to different needs, so you need to choose accordingly. Many developers fail to optimize their applications because they have no idea about GC algorithms.
The four algorithms are the Serial Collector, Parallel/Throughput collector, CMS collector, and the G1 collector. To learn more about each of the garbage collectors and how they work, check out the amazing Garbage Collectors—Serial vs. Parallel vs. CMS vs. G1 from the Takipi blog. The article also discusses the Java 8 impact on the GC algorithm and other minute changes.
Coming back to the GC algorithm, according to Understanding Java Garbage Collection, the Concurrent Mark & Sweep GC (or "CMS") algorithm is the best algorithm choice for web server applications. Parallel GC algorithm is great for the application that has built-in predictability.
G1 and CMS are ideal for concurrent operations, but will also cause frequent pauses. The choice also depends on the trade-offs. For example, it is a good idea to choose parallel algorithm even when it has longer GC pause time compared to other GC algorithms.
3. Java heap
The Java memory heap plays a crucial role in keeping up with the memory requirement. It is always better to start with minimum heap allocation, then increase it with continued testing. Most of the time the optimization problem is solved by increasing heap size, but the solution doesn't work if there is a lot of GC overhead.
GC overhead also makes throughput too low, making the application undesirably slow. Furthermore, tuning GC earlier can help you avert the problems with heap size allocation. To get started, you can choose any heap size from 1GB to 8GB. The concept of old generation and new generation objects also kicks in while choosing the right heap size.
In the end, the heap size should depend on an old generation to new generation object ratio, previous GC optimization, and liveset, which is the memory size of objects.
4. Core app optimization
Core code optimization is the best way to optimize your Java application. If your application is not responding to GC and heap optimization, it is better to do architectural changes and concentrate on how your application processes information. Using clever algorithms and taking care of objects can solve a lot of problems including fragmentation, heap issues, and garbage collection issues.
5. Using optimal functions
Java has multiple functions to handle algorithmic performance. If you use StringBuilder instead of simple String, you will gain few improvements in performance. However, there are other ways to handle optimization at the code level. Let's look at them below.
- Use StringBuilder instead of the + operator.
- Avoid using the iterator().
- Take maximum benefit of the stack.
- Avoid regular expressions and instead use Apache Commons Lang.
- Stay away from recursion. Recursions are very resource intensive!
Read more about Java code optimization in Top 10 Easy Performance Optimisations in Java.
Conclusion
Java performance optimization is a big subject, and this article clearly doesn't cover everything. If you think something needs to be added to the article, don't forget to share it with the audience by commenting below.


1 Comment