Open source software and open data play key roles in implementing Chile's long-term energy planning, identifying ways to get the maximum value from development, minimizing its impact, and requiring less development overall.
Over the past two years, our company—in partnership with the Centro UC Cambio Global of the Pontificia Universidad Católica de Chile—has been designing, building, and testing a framework to support Chile's Ministry of Energy in policy evaluation and regional hydroelectric power planning activities. Open source software and open data play a key role in this framework, but before I explain how, I need to summarize the context.

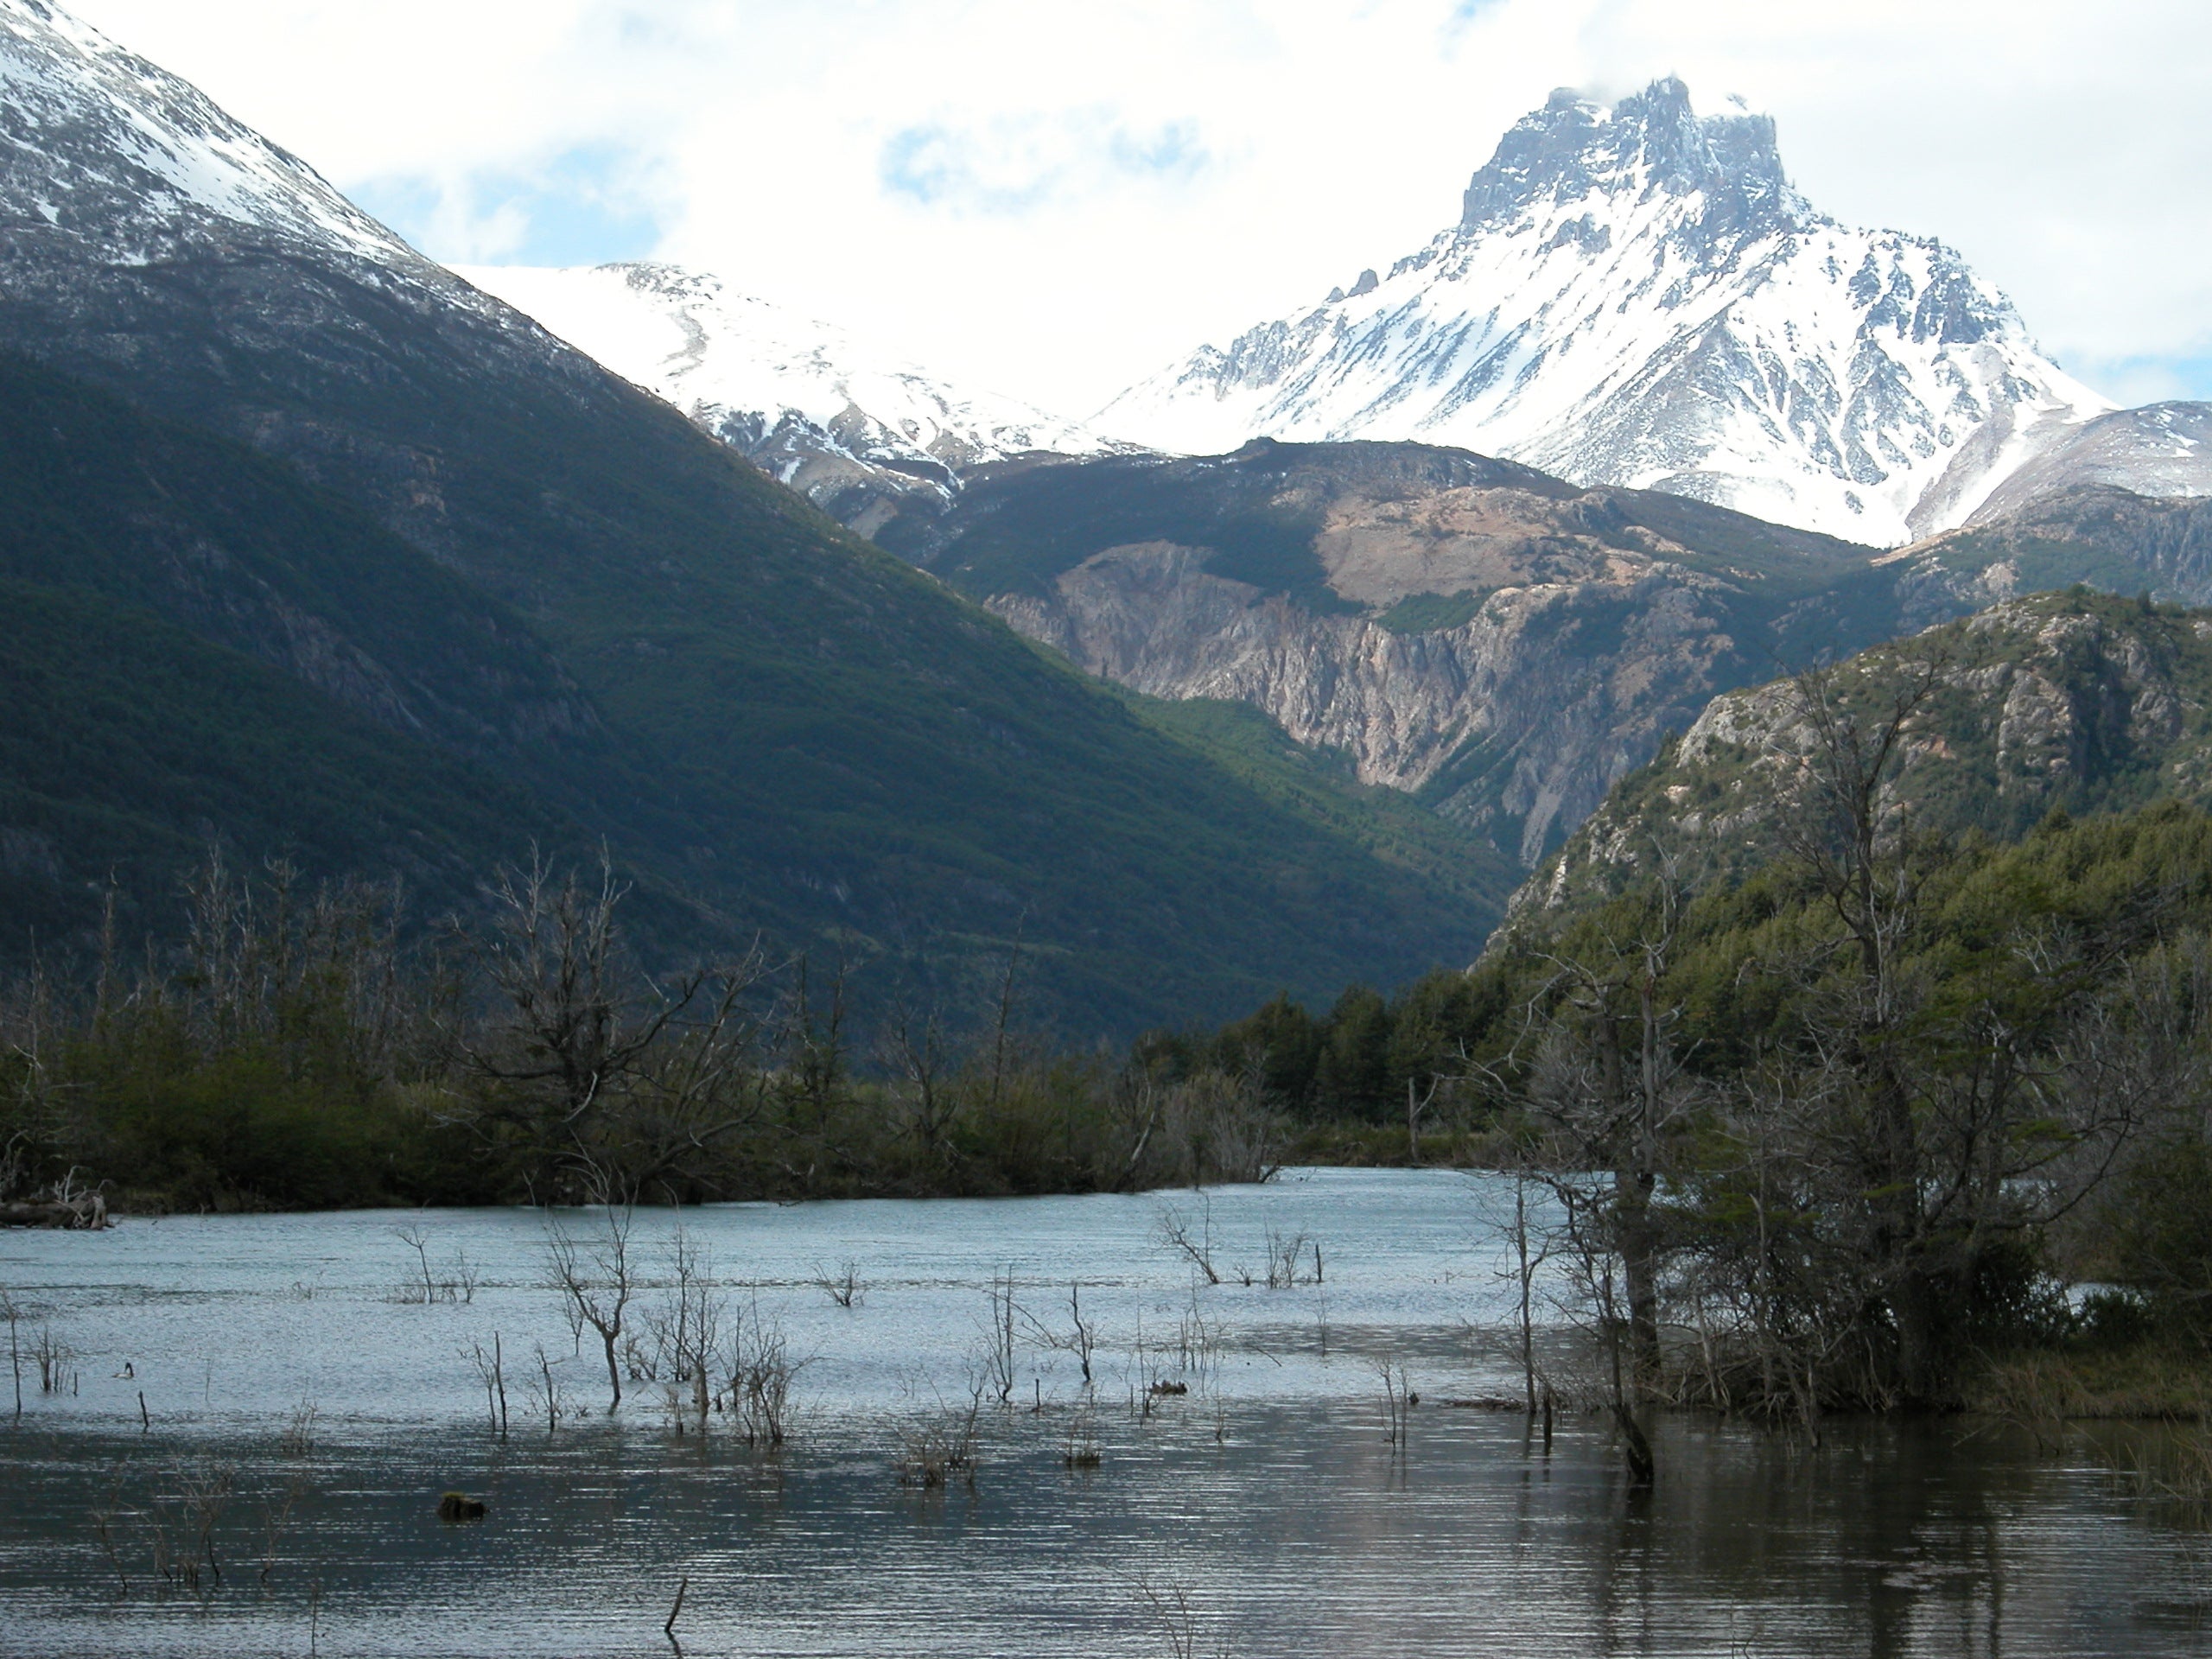
Aysén Region in Chile, near Bahía Muerta on Lago General Carrera
Clean, renewable, cheap, and aesthetic
The government of Chile recently approved the Ministry of Energy's New Energy Policy 2050. This policy addresses five key strategic issues:
- security and quality of supply
- energy as a driver of development
- energy that is compatible with the environment
- energy efficiency and education
- process for followup and review of energy policy
The policy requires hydroelectric power to play an important role in providing base load, augmented by wind and solar. All of these generation technologies are already important in Chile's energy matrix, but currently there is a reliance on thermoelectric plants (fueled by fossil fuels), and we must transition away from them between now and 2050.
The current energy matrix has created a number of problems that the new policy must address in order to be successful. There are odd asymmetries—for example, finding the highest consumer electricity cost in the neighborhood of generation projects is not uncommon, because those neighbors can only get energy that first has been sent to the backbone, then returned to the neighborhood, which makes it costly. Energy generation and transmission projects often create adverse local effects, for example by lowering the aesthetic quality of the landscape, which adversely affects property values.
The Ministry wanted to build a planning and evaluation capability that will find development patterns that already reflect policy and regulation, and at the same time reduce the footprint created by those development patterns on other land use. Our partnership undertook the first phase of this study, identifying and characterizing the hydroelectric potential and other land use values in Chile's "hydro zone", which stretches from Santiago in central Chile to Puerto Montt further south, a distance of approximately 1,000 km. Once we completed this study, the Ministry proceeded with two further studies, partitioning the area into the northern and southern halves; our partnership carried out the northern half, and a team from the University of Chile undertook the southern half. The purpose of these studies was to move to a finer level of detail of interaction between hydroelectric power potential and other landscape values.
What did we actually do?
First, we extended and adapted the High Conservation Value methodology as a way of measuring landscape values. Specifically, we looked at fluvial ecosystems, terrestrial ecosystems, social subsistence needs, indigenous and non-indigenous cultural structure, and other productive uses of the land.
We then identified a total of 45 "objetos de valoración" (object value ratings) or OdVs, such as endangered fluvial species, units of landscape in natural state, and presence of indigenous communities, using publicly available (open) datasets, and in some cases conducting field work where important data was not available, such as presence of fish in streams. We developed a spatial database that could support the identification of locale and attributes of the presence of these OdVs.
Our fluvial ecology team classified fluvial attributes on uniform segments of rivers called reaches. All the non-fluvial attributes necessary to calculate those OdVs already existed.
We considered using the PostGIS spatial database extender for the PostgreSQL object-relational database. However, we decided the client and other prospective users would be more comfortable receiving and using the data as Shapefiles, a more-or-less open format usable in many geographic information systems.

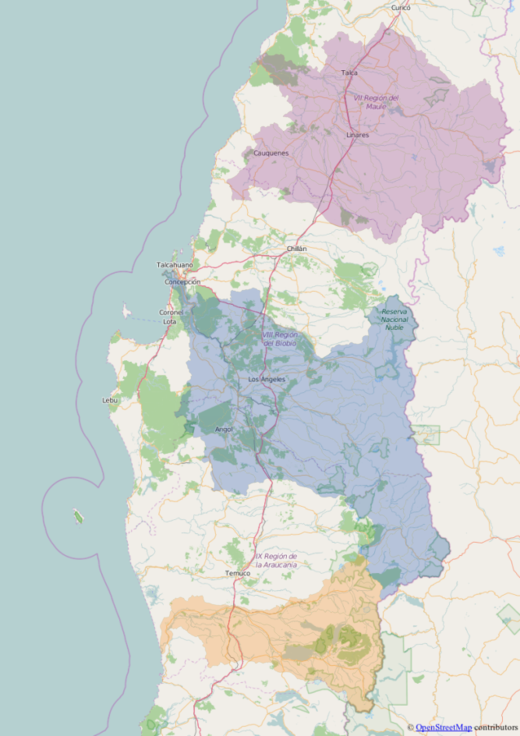
The three northern watersheds evaluated by our project team.
CC BY-SA 4.0 Data from OpenStreetMap and Chile's Ministry of Public Works
We already had the points of intake and restitution for each potential hydroelectric project in our study area, also in Shapefile format, so we linked those points to the river reaches and oriented all the reaches so that they started at upstream points and ended at downstream points, using the open source ogr2ogr, QGIS, and shell scripting.
 By this time we had decided that the unit of analysis was going to be the project, and we could therefore in principle assemble all the river reaches related to the intake and restitution points. And because all the fluvial OdVs were already on the river reaches, we decided that the logical thing to do was to transfer the non-fluvial OdVs onto the same reaches. So, for example, a river running through a national park or nearby an indigenous community could "receive" the presence of those OdVs. One of my colleagues who likes to use a (cough cough) closed-source GIS used that tool to transfer the non-fluvial OdVs to the river reaches. But we could have used QGIS.
At this point we had all of the OdVs, fluvial or otherwise, on river reaches and it was time to group those reaches into projects. This required relatively heavy-duty scripting, for which we chose the open source Groovy programming language in general, open source GeoScript-Groovy spatial extensions, and the open source OpenCSV to read and write files that could be used in QGIS or LibreOffice Calc. Have I mentioned that I really like Groovy, and that GeoScript provides a lovely groovy way to "do spatial stuff"? Yeah!
Finally, we had a file in CSV format with three colums: project identifier, hydroelectric potential of the project in megawatts, and the total value of OdVs associated with the reaches related to the project. To select the "best" projects, we adapted the wonderful 0-1 Knapsack code on RosettaCode. Look at that, 11 lines of groovy goodness to implement a dynamic programming solution to the 0-1 Knapsack problem. Can't beat that!
With all these bits and pieces—mostly open source and open data—we could test the framework out on a bunch of different scenarios. One of the really interesting things we learned is that the hydroelectric potential is extremely concentrated, and that it is possible to generate a considerable amount of power while only interacting with 5% or less of the other landscape values. I believe this to be one of the most profound outcomes of our work: There is a kind of efficiency at work here, looking for a way to get maximum value from a given amount of development and therefore requiring less development and less impact overall, and in turn creating better opportunity for inclusivity.
And, because the framework is made from open source components, there's no reason others can't use it to solve their own resource allocation problems.


Comments are closed.