The point of a network monitoring solution is, of course, to tell you when something malfunctions on your network, but the effectiveness of a solution is directly related to how noticeable and timely its alerts are.
For my work, system-malfunction emails can be overwhelming, so I thought a chatbot service would be more useful. After doing some research, it seemed like I already had two tools that would do the job: Mattermost and Zabbix. But how do I make them work together?
Zabbix is an open source distributed monitoring solution with a wide variety of community developed plugins and handy integration tools (e.g. Grafana). I have used it to monitor my home network devices, server infrastructure, and services (e.g. Elastic stack, formerly known as ELK stack). Mattermost is an MIT-licensed, cross-platform messaging service. It's open source and welcomes pull requests to its GitHub repos. On my network, I use Mattermost for most notifications, like the current weather, train schedule, etc.
I decided that integrating my existing Mattermost chat server with my Zabbix monitoring server would be quite simple and give me the tools I needed to better monitor my home network. The idea was to create a separate channel used specifically for system alerts that I could subscribe to or mute as I pleased. I also had the option to set specific notifications—e.g., hypervisor down—to notify a specific user.
Here's a step-by-step guide to how I built my setup; hopefully it will help you build your own.
Prerequisite hardware and software
Here's what I used to get this off the ground:
- HP ProLiant MicroServer Gen8 server hardware
- VMware ESXi hypervisor
- CentOS 7.x x64 virtual machine that can access the internet, outbound for Docker/HTTP(S) GET
- Docker and the Docker daemon running
Setting up Mattermost and Zabbix
I'm using the Docker version of Mattermost, but you can also install it as a full application on your server. To download the Docker image and start it (once you have Docker already running), you can use the following commands:
docker run --name mattermost-preview -d --publish 8065:8065 mattermost/mattermost-previewIf that doesn't work, consult the Docker setup guide for additional help.
Setting up Zabbix to monitor remote servers is usually quite pain-free, but its configuration can be a bit tricky. Thankfully there is a huge amount of information in Zabbix's documentation and forums, and DigitalOcean offers a really good setup guide. This guide is most useful when you add a node for Zabbix to monitor (rather than just monitoring the server).
Once you have Zabbix and Mattermost set up, log into each system and secure them (see "What about security?" below). You can use any email address you choose for your test instance of Mattermost.
Setting up single sign-on
If you're setting this up in an enterprise environment, you might want to enable single sign-on (SSO). Mattermost's community edition does not have direct Active Directory (AD) integration options, but if you use the version included in GitLab or have a GitLab server, you can tie Mattermost to GitLab, and GitLab can do the authentication to AD.
Configuring Zabbix
Write your alerting script
The alerting script can be written in whatever language you want. A simple Bash script sufficed for my needs, and you can quickly build on this basic example script to make an alerting script that's more useful to you.
By default, Zabbix will look in the /usr/lib/zabbix/alertscripts directory on the CentOS 7 package provided by Zabbix, but this can be changed by modifying the AlertScriptsPath in the Zabbix configuration. Make sure the script is executable for the correct users.
If you start with the Bash script example linked above, make sure to change the webhook key and IP address. For more information about setting up incoming webhooks, see "Configuring Mattermost" below or check the Mattermost documentation.
Once the script is in place, it's time to configure Zabbix to use the script, add the media type to the alerts, and configure Zabbix to send alerts to your user(s).
Add the new media type
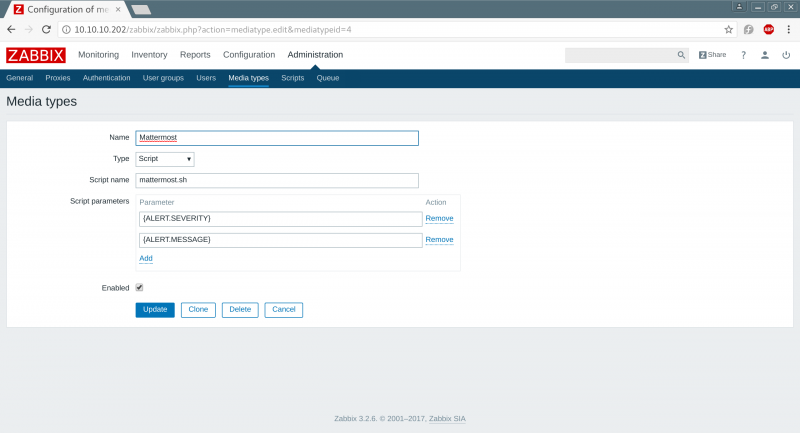
To add a new alerting mechanism to Zabbix, you need to tell it how to use the script you put in place in the previous section by adding the script to Zabbix's Administration > Media types section.
opensource.com
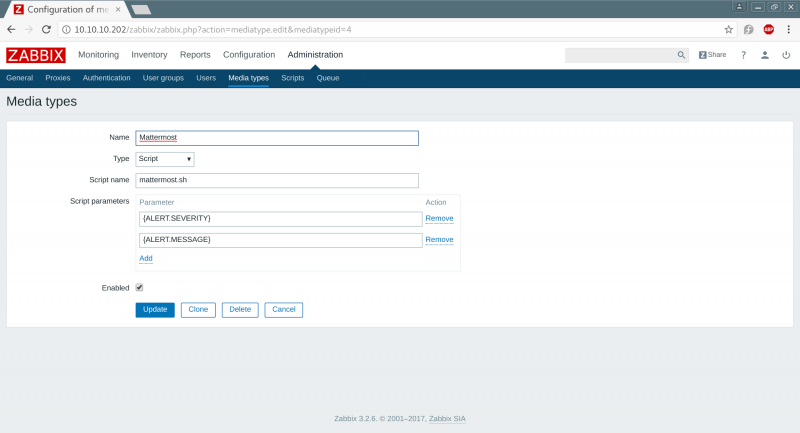
In the "Name" field, enter any name you choose for the new media type. Select "Script" in the "Type" drop-down, and in the "Script name" field enter the name of the script you wrote in the previous section (e.g., mattermost.sh). The "Script parameters" section defines what will be passed directly to the script (e.g., in Bash reference $1 and $2 in the script).
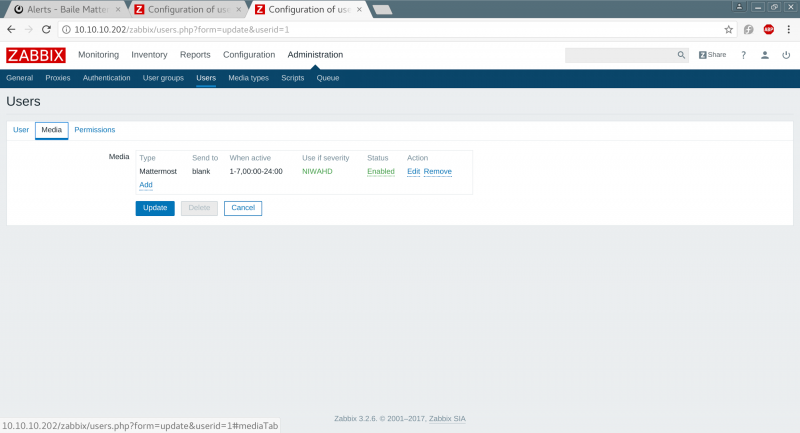
For Zabbix to use the new script to send an alert to a user, it must be configured in the user's Media settings (i.e., Administration > Users > Media). Here, you can add the media type and set its active hours (e.g., 24x7 on all types of alerts etc.). You can find more information on configuring a host in the Zabbix documentation.
opensource.com
Now Zabbix is all set to go.
Configuring Mattermost
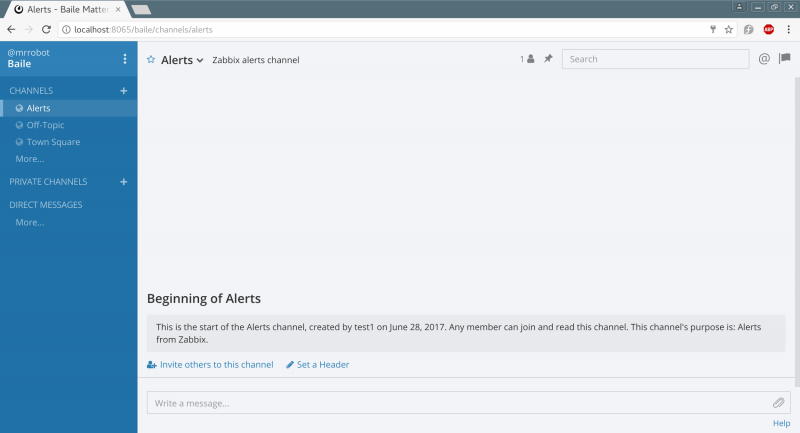
Once you have spun up Mattermost and configured an account, you should create a new channel for alerts.
opensource.com
You need to enable incoming webhooks before you can configure them for an individual channel/user. This can be done in the Mattermost system console in Integrations > Custom Integrations > Enable Incoming Webhooks.
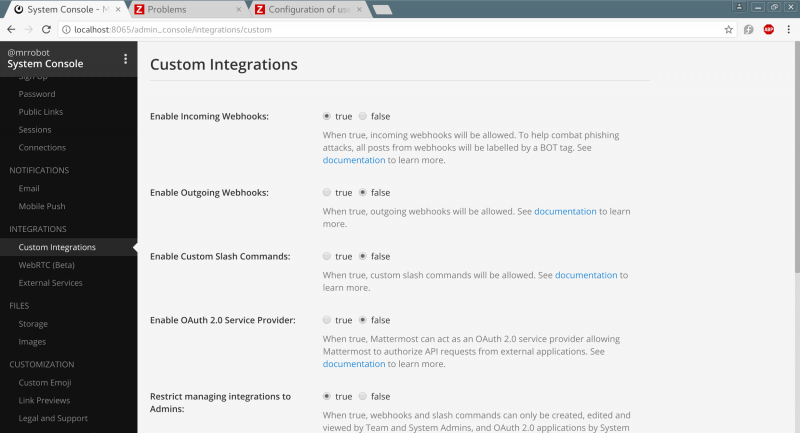
opensource.com
Once the webhooks are enabled, you need to configure an incoming webhook using a URL similar to that in the image below.
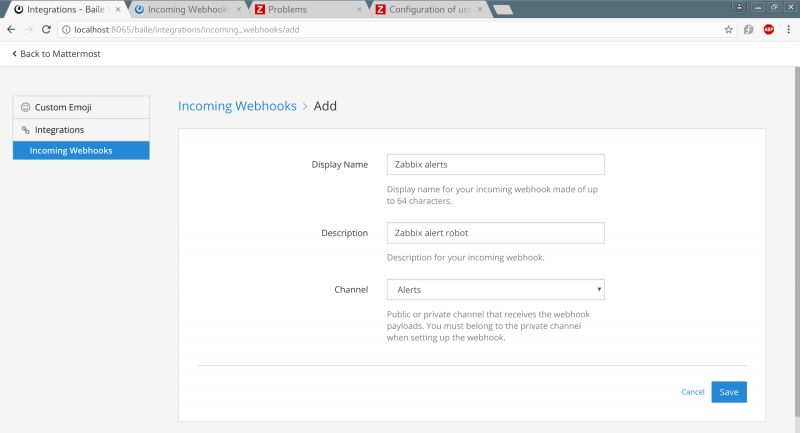
opensource.com
Testing alerts
You can use lots of methods to make Zabbix trigger an alert, but the easiest way is to monitor a host and reboot it (wait for the Zabbix alerts to flood in) or setup a simple service monitor e.g. HTTPD monitoring and use netcat to listen on port 80, once Zabbix probes the netcat, the session will end and Zabbix will throw and alert after a few minutes saying the service has recovered/shut down.
Setting up mobile alerts
If you want to see alerts on your phone, you can download Mattermost apps for iPhone and Android. The app can be easily configured to point to the URL of the Mattermost instance, allowing you to easily monitor alerts and channels from your smartphone.
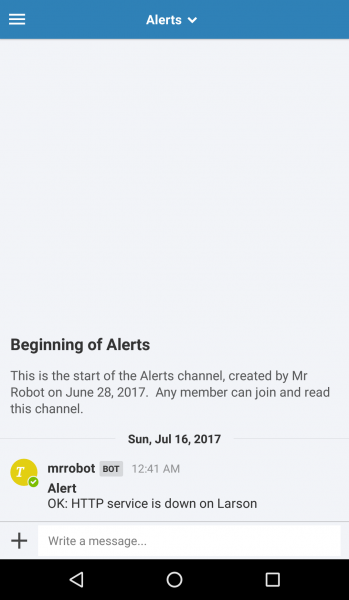
opensource.com
What about security?
To securely reach my VMs and monitor them remotely, I set up a VPN endpoint on my phone that connects to my network's VPN endpoint. I can also access them internally when my phone is connected to the internet and the VPN. (Admittedly, I wasn't too concerned about the security of my VMs and software, as they are all running on my segregated home test network.)
If you're looking for deeper security, here is a non-exhaustive list of basic best practices for security hardening:
- Enable SSL and use appropriate SSL certificates from your internal certificate authority, a paid-for trusted certificate provider, or a free certificate (e.g., Let's Encrypt).
- Use password policies and account naming conventions aligned with best practices (e.g., don't use guest accounts and make sure to add the guest account to the disabled group).
- Change the default Zabbix password and ensure that it only listens on port 443.
- Verify that all services are listening only on the required interfaces.
- Protect your webhook and don't expose it to untrusted networks/devices.
- In general, don't expose any services to the internet or untrusted networks if they don't need to be.
- Ideally, run these services on separate nodes or in separate containers.
- Secure your host with a local firewall or filtering service.
Taking it a step further
With more time, it would be really useful to build a chatbot to manage notifications so I don't have to go into Zabbix and deal with alerts. This would allow me to silence an alert for a flapping disk consumption warning, etc. It could also be helpful to add more context to alerts, and Zabbix's supported macros offer options to expand the basic alert. And, finally, in practice, it's always best to distribute monitoring across several sites so you have a better chance of knowing when a datacenter has dropped offline.
What ideas do you have for making this monitoring and alerting system even more useful? Please share your ideas in the comments.


2 Comments