

This article is excerpted from chapter 13 of the book Linux in Action, published by Manning.
Has the performance of your Linux machine been erratic or unusually slow? Do you suspect that growing demand might be outstripping your available resources? Here are some questions you should be asking yourself:
- How close are you to exhausting your CPU and memory resources?
- Is there something running unnecessarily that could be shut down?
- Is there something that's been running rogue without your knowledge?
Where should you look for answers? The top program is a great place to start. It can give you a rich, self-updating overview of the processes running on your system.
The figure below shows a typical screen of top data. The first line provides the current time, the elapsed time since the most recent system boot, the number of users currently logged in, and load averages for the last minute, five minutes, and 15 minutes. This information can also be returned by running uptime.
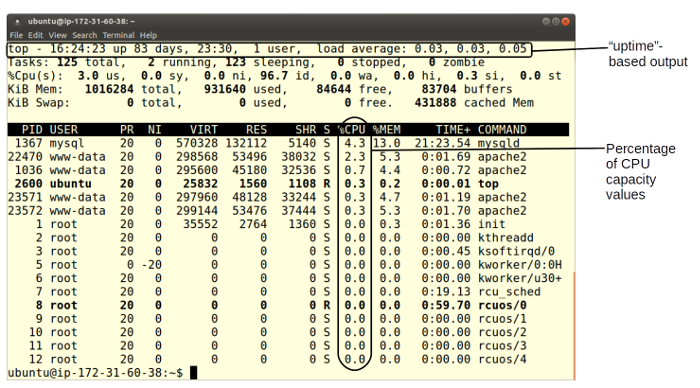
opensource.com
Since we're trying to resolve performance problems, the columns of data that should interest us the most are %CPU (percentage of CPU capacity currently used by a given process) and %MEM (percentage of memory capacity). You'll especially want to note the processes showing up at the top of the list.
In this case, you can see that the MySQL daemon is using 4.3% of the server's CPU and, from the next column, 13% of its memory. If you follow that row over to the left, you'll see that the process ID (PID) is 1367 and the process is "owned" by the mysql user.
Perhaps you'll conclude that this process was taking more resources than can be justified and will have to be sacrificed (for the greater good, you understand). That top display gave you everything you'll need to kill it. Since MySQL is a service managed by systemd (on those distros using systemd), your first choice should be to use systemctl to bring the process down gently without putting any application data at risk.
systemctl stop mysqldIf the process you want to shut down is not managed by systemd, or if something's gone wrong and systemctl failed to stop it, then you can use either kill or killall to eliminate your process. Some systems require you to install killall as part of the psmisc package. You pass the PID to kill this way:
kill 1367killall, on the other hand, uses the process name rather than its ID.
killall mysqldTo kill or to killall, that is the question. Actually, the answer is kind of obvious. kill will shut down a single process, based as it is on the PID, while killall will kill as many instances of a particular program as are running. So if there were two or three separate MySQL instances—perhaps belonging to separate users—all would be stopped. Before launching killall, make sure there aren't any similarly named processes you still want running that could become "collateral damage."
Of course, you'll also have to run systemctl disable to make sure the process doesn't restart the next time you boot.
systemctl disable mysqldDeciphering top
In case you ever need them, the third line of top output you saw a bit earlier gives us time values (as percentages) for a number of other CPU metrics. Here's a quick rundown of the jumble of acronyms you'll see there:
| Metric | Meaning |
|---|---|
us |
Time running high-priority (un-niced) processes |
sy |
Time running kernel processes |
ni |
Time running low-priority (nice) processes |
id |
Time spent idling |
wa |
Time waiting for I/O events to complete |
hi |
Time spent managing hardware interrupts |
si |
Time spent managing software interrupts |
st |
Time stolen from this VM by its hypervisor (host) |
The top display can be customized in real time through keyboard input. Type h to learn more.
Making trouble (simulating CPU load)
Dying to see top in action but, wouldn't you know it, everything is running smoothly?
Why not simulate crisis-level CPU overload? Much like children, yes will output (digital) noise continuously until told to stop. On second thoughts, that's not at all like children.
This command will redirect that noise to the disposable /dev/null file and the & character will push the process into the background, giving control of the command line back to you. To ramp up the pressure, launch the command a few more times.
$ yes > /dev/null &That should keep 'em busy. While all that's running, watch top to see what's happening. You could also try to run other applications to see how much it will take to slow them down. When you're done, run killall to knock off all your yes sessions in one go.
$ killall yes


10 Comments