Grafana's Tempo is an easy-to-use, high-scale, distributed tracing backend from Grafana Labs. Tempo has integrations with Grafana, Prometheus, and Loki and requires only object storage to operate, making it cost-efficient and easy to operate.
I've been involved with this open source project since its inception, so I'll go over some of the basics about Tempo and show why the cloud-native community has taken notice of it.
Distributed tracing
It's common to want to gather telemetry on requests made to an application. But in the modern server world, a single application is regularly split across many microservices, potentially running on several different nodes.
Distributed tracing is a way to get fine-grained information about the performance of an application that may consist of discreet services. It provides a consolidated view of the request's lifecycle as it passes through an application. Tempo's distributed tracing can be used with monolithic or microservice applications, and it gives you request-scoped information, making it the third pillar of observability (alongside metrics and logs).
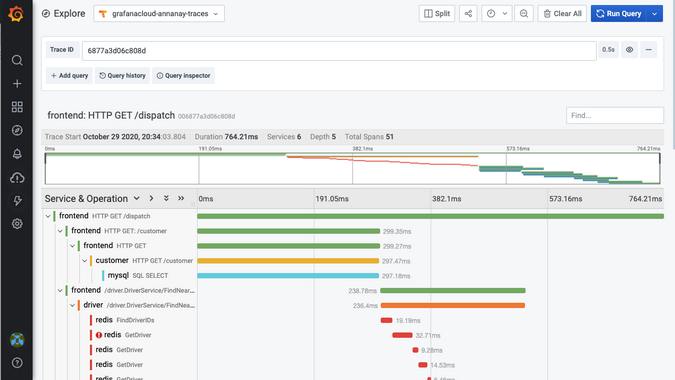
The following is an example of a Gantt chart that distributed tracing systems can produce about applications. It uses the Jaeger HotROD demo application to generate traces and stores them in Grafana Cloud's hosted Tempo. This chart shows the processing time for the request, broken down by service and function.

(Annanay Agarwal, CC BY-SA 4.0)
Reducing index size
Traces have a ton of information in a rich and well-defined data model. Usually, there are two interactions with a tracing backend: filtering for traces using metadata selectors like the service name or duration, and visualizing a trace once it's been filtered.
To enhance search, most open source distributed tracing frameworks index a number of fields from the trace, including the service name, operation name, tags, and duration. This results in a large index and pushes you to use a database like Elasticsearch or Cassandra. However, these can be tough to manage and costly to operate at scale, so my team at Grafana Labs set out to come up with a better solution.
At Grafana, our on-call debugging workflows start with drilling down for the problem using a metrics dashboard (we use Cortex, a Cloud Native Computing Foundation incubating project for scaling Prometheus, to store metrics from our application), sifting through the logs for the problematic service (we store our logs in Loki, which is like Prometheus, but for logs), and then viewing traces for a given request. We realized that all the indexing information we need for the filtering step is available in Cortex and Loki. However, we needed a strong integration for trace discoverability through these tools and a complimentary store for key-value lookup by trace ID.
This was the start of the Grafana Tempo project. By focusing on retrieving traces given a trace ID, we designed Tempo to be a minimal-dependency, high-volume, cost-effective distributed tracing backend.
Easy to operate and cost-effective
Tempo uses an object storage backend, which is its only dependency. It can be used in either single binary or microservices mode (check out the examples in the repo on how to get started easily). Using object storage also means you can store a high volume of traces from applications without any sampling. This ensures that you never throw away traces for those one-in-a-million requests that errored out or had higher latencies.
Strong integration with open source tools
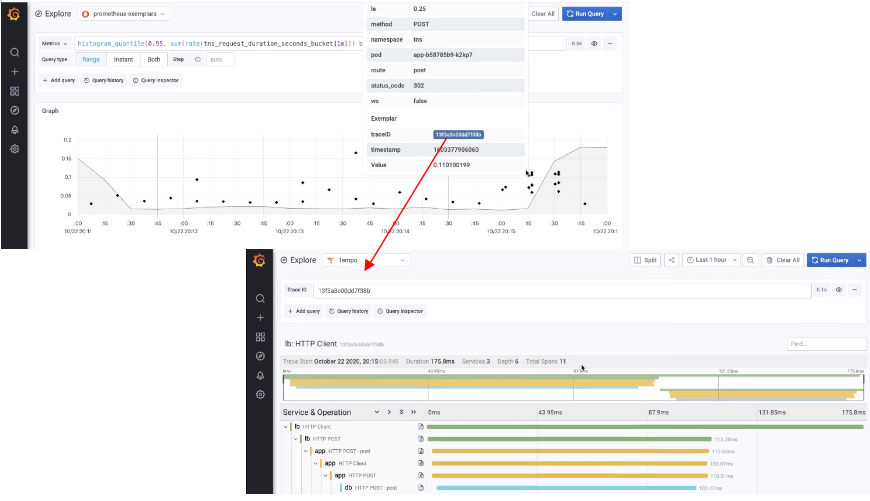
Grafana 7.3 includes a Tempo data source, which means you can visualize traces from Tempo in the Grafana UI. Also, Loki 2.0's new query features make trace discovery in Tempo easy. And to integrate with Prometheus, the team is working on adding support for exemplars, which are high-cardinality metadata information you can add to time-series data. The metric storage backends do not index these, but you can retrieve and display them alongside the metric value in the Grafana UI. While exemplars can store various metadata, trace-IDs are stored to integrate strongly with Tempo in this use case.
This example shows using exemplars with a request latency histogram where each exemplar data point links to a trace in Tempo.

(Annanay Agarwal, CC BY-SA 4.0)
Consistent metadata
Telemetry data emitted from applications running as containerized applications generally has some metadata associated with it. This can include information like the cluster ID, namespace, pod IP, etc. This is great for providing on-demand information, but it's even better if you can use the information contained in metadata for something productive.
For instance, you can use the Grafana Cloud Agent to ingest traces into Tempo, and the agent leverages the Prometheus Service Discovery mechanism to poll the Kubernetes API for metadata information and adds these as tags to spans emitted by the application. Since this metadata is also indexed in Loki, it makes it easy for you to jump from traces to view logs for a given service by translating metadata into Loki label selectors.
The following is an example of consistent metadata that can be used to view the logs for a given span in a trace in Tempo.
Cloud-native
Grafana Tempo is available as a containerized application, and you can run it on any orchestration engine like Kubernetes, Mesos, etc. The various services can be horizontally scaled depending on the workload on the ingest/query path. You can also use cloud-native object storage, such as Google Cloud Storage, Amazon S3, or Azure Blog Storage with Tempo. For further information, read the architecture section in Tempo's documentation.
Try Tempo
If this sounds like it might be as useful for you as it has been for us, clone the Tempo repo or sign up for Grafana Cloud and give it a try.


Comments are closed.