

When I am checking out Linux systems (or even troubleshooting computers running other operating systems), I frequently use the top command to check out the system's RAM and CPU utilization. It provides me with information to assess the computer's overall health. I learned about the top command early in my Linux journey and have relied on it to give me a quick overview of what is happening on servers or other Linux systems, including Raspberry Pi. According to its man page, the top program provides a dynamic real-time view of a running system. It can display system summary information as well as a list of processes or threads currently being managed by the Linux kernel.
A quick overview is often all I need to determine what is going on with the system in question. But there is so much more to the top command than meets the eye. Specific features of your top command may vary depending on whose version (procps-ng, Busybox, BSD) you run, so consult the man page for details.
To launch top, type it into your terminal:
$ topRunning processes are displayed below the table heading on the top screen, and system statistics are shown above it.
Top 05:31:09 up 55 min,3 users,load average: 0.54, 0.38, 0.46
Tasks: 469 total, 1 running, 468 sleeping,  0 stopped, 0 zombie
%Cpu(s): 1.0 us, 0.4 sy, 0.0 ni, 98.6 id, 0.1 wa, 0.0 hi,0.0 si,0.0 st
MiB Mem : 32116.1 total,  20256.5 free, 6376.3 used, 5483.3 buff/cache
MiB Swap: 0.0 total,  0.0 free,      0.0 used.  25111.4 avail Mem

 PID USER  PR NI   VIRT    RES   SHR S %CPU %MEM    TIME+ COMMAND
2566 don   20  0  11.9g 701300 78848 S  3.3  2.1  2:03.80 firefox-bin
1606 don   20  0  24.2g  88084  4512 S  2.0  0.3  0:39.59 elisa
1989 don   20  0 894236 201580 23536 S  2.0  0.6  0:46.12 stopgo-java
5483 don   20  0  24.5g 239200 20868 S  1.3  0.7  0:26.54 Isolated Web Co
5726 don   20  0 977252 228012 44472 S  1.3  0.7  0:41.25 pulseaudio
Press the Z key to change the color of the output. I find this makes the output a little easier on the eyes.
Press the 1 key to see a graphical representation of each CPU core on the system. Press 1 repeatedly to assess core statistics for your CPU cores.
You can display memory usage graphically by invoking the top command and then pressing the m key.
Useful top options
If you're looking only for the processes started by a specific user, you can get that information with the -u option:
$ top -u 'username'To get a list of idle processes on your system, use the -i option:
$ top -iYou can set the update interval to an arbitrary value in seconds. The default value is three seconds. Change it to five like this:
$ top -d 5You can also run top on a timer. For instance, the following command sets the number of iterations to two and then exits:
$ top -n 2Locate a process with top
Press Shift+L to locate a process by name. This creates a prompt just above the bold table header line. Type in the name of the process you're looking for and then press Enter or Return to see the instances of that process highlighted in the newly sorted process list.
Stopping a process with top
You can stop or "kill" a running process with top, too. First, find the process you want to stop using either Shift+L or pgrep. Next, press K and enter the process ID you want to stop. The default value is whatever is at the top of the list, so be sure to enter the PID you want to stop before pressing Enter, or you may stop a process you didn't intend to.
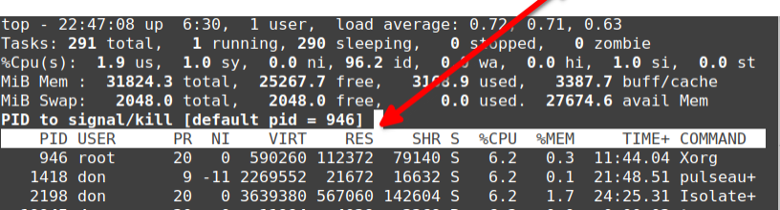
(Don Watkins, CC BY-SA 4.0)
Top top
There are many iterations of the top command, including htop, atop, btop, and ttop. There are specialized top commands, too, like powertop for power usage and ntop for networks. What's your favorite top?


4 Comments