Infrastructure environments' needs and demands change every year and systems become more complex and involved. But all this growth is meaningless if we don't understand the infrastructure and what's happening in our environment. This is where monitoring tools and software come in; they give operators and administrators the ability to see problems in their environments and fix them in real time.
But what if we want to predict problems before they happen? Collecting metrics and data about our environment gives us a window into how our infrastructure is performing and lets us make predictions based on data. When we know and understand what's happening, we can prevent problems, rather than just fixing them.
Before we can use this data, we need to figure out how to collect and store it. For example, if we want to collect data on the CPU usage of 100 machines every 10 seconds, we're generating a lot of data. On top of that, what if each machine is running 15 containers and you want to generate data about each of those individual containers too? What if we want to generate data per process? This is where time-series data becomes helpful. Time-series databases store time-series data. But what does that mean? We'll explain all of this and more, plus introduce you to InfluxDB, an open source time-series database. By the end of this article, you will understand:
- What time-series data and databases are
- Basic information about InfluxDB and the TICK stack
- How to install InfluxDB and other tools
Introducing time-series concepts

opensource.com
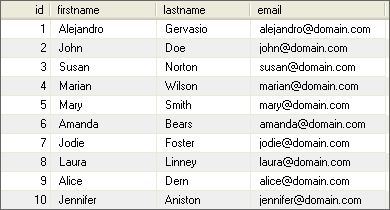
If you're familiar with relational database management software (RDBMS) like MySQL, tables, columns, and primary keys are familiar terms. Everything is like a spreadsheet, with data in columns and rows. Some data might be unique, other parts might be the same as other rows. Relational databases are widely used and great for reliable transactions that follow ACID (atomicity, consistency, isolation, and durability) compliance and data you could model in a table. You might update certain data by overwriting and replacing it.
But what if you're collecting data on something that generates a lot of data, like a self-driving car, and you want to watch how the data changes over time? The car is constantly collecting information about its environment. It takes this data and it analyzes changes over time to behave correctly. The amount of data might be tens of gigabytes an hour. While you could use a relational database to collect this data, when it comes to scaling and usability of the data you're collecting, an RBDMS isn't the best tool for the job.
Why time-series is a good fit
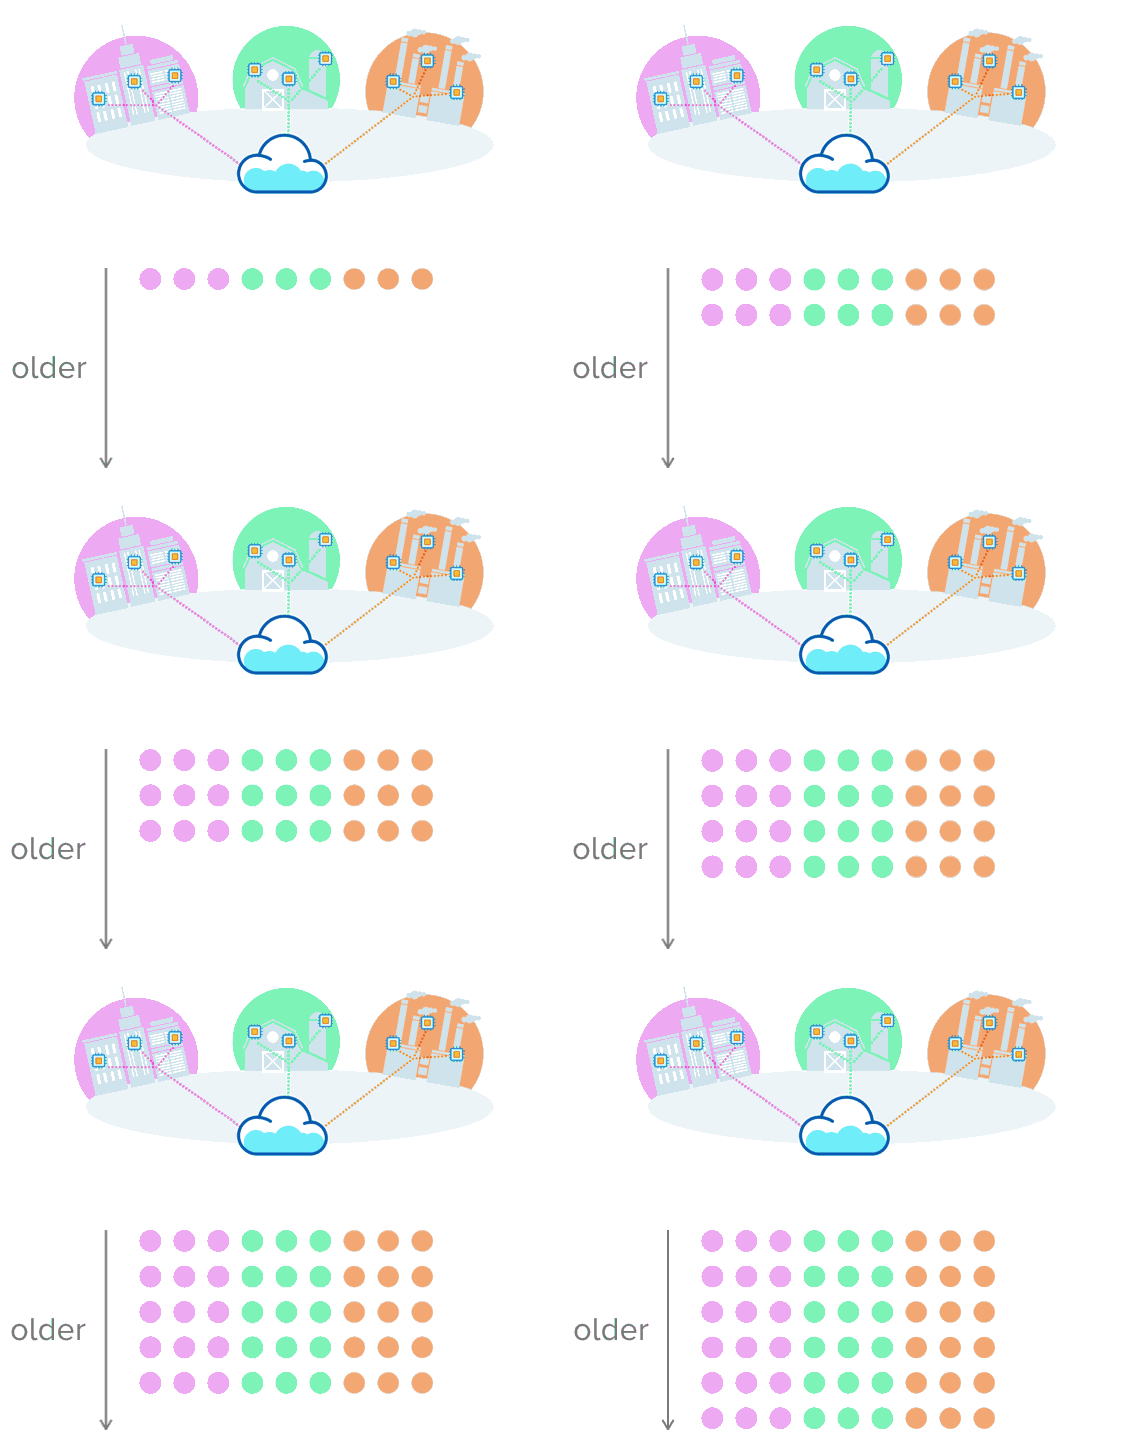
This is where time-series data makes sense. Let's say you're collecting data about a city's traffic, temperature from farming equipment, or the production rate of an assembly line. Instead of putting the data into a table with rows and columns, imagine pushing multiple rows of data that are uniquely sorted with a timestamp. This visual might help make more sense of this:

opensource.com
Having the data in this format makes it easier to track and watch change over time. When data accumulates, you can see how something behaved in the past, how it's behaving now, and how it might behave in the future. Your options to make smarter data decisions expand!
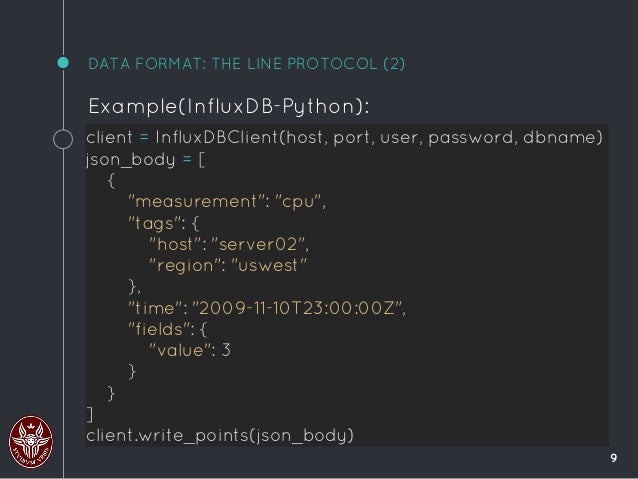
Curious how the data is stored and formatted? It depends on the time-series database you use. InfluxDB stores the data in the Line Protocol format. Queries return the data in JSON.

opensource.com
To learn more about time-series data or why you would want to use it over another solution, Timescale and InfluxData offer excellent, in-depth explanations.
InfluxDB: A time-series database
InfluxDB is open source time-series database software developed by InfluxData. It's written in Go (a compiled language), which means you can start using it without installing any dependencies. It supports multiple data ingestion protocols, such as Telegraf (also from InfluxData), Graphite, Collectd, and OpenTSDB. This leaves you with flexible options for how you want to collect data and from where you're pulling it. It's also one of the fastest-growing time-series database software options available. You can find the source code for InfluxDB on GitHub.
Let's take a look at using three tools in InfluxData's TICK stack to build a time-series database and begin collecting and processing data.
TICK stack
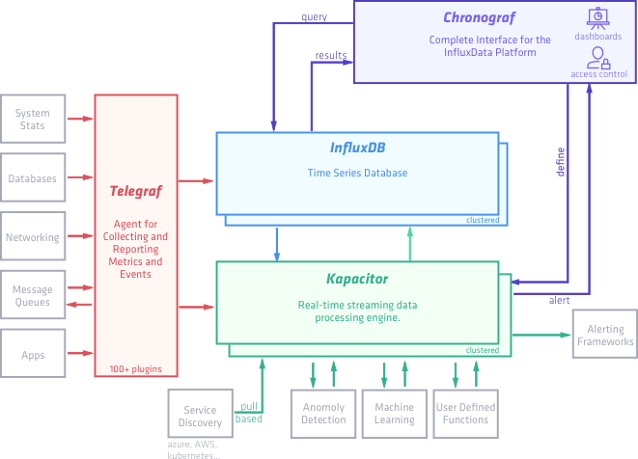
InfluxData's platform is based on four open source projects that work and play well with each other for time-series data. By using them together, you can easily collect, store, process, and view the data. The four pieces of the platform are known as the TICK stack, which stands for:
- Telegraf: Plugin-driven server agent for collecting and reporting metrics
- InfluxDB: Scalable data store for metrics, events, and real-time analytics
- Chronograf: Monitoring/visualization user interface for TICK stack (not covered in this article)
- Kapacitor: Framework for processing, monitoring, and alerting on time-series data
These tools work and integrate well with the other pieces by design. However, it's also easy to substitute one piece out for another tool of your choice. Here, we'll explore three parts of the TICK stack: InfluxDB, Telegraf, and Kapacitor.

opensource.com
InfluxDB
As mentioned, InfluxDB is the TICK stack's time-series database. There are a few things that make InfluxDB stand out from other time-series databases.
- Emphasis on performance: Performance is one of InfluxDB's top priorities. This allows you to use data quickly and easily, even under heavy loads. To do this, InfluxDB focuses on quickly ingesting the data and using compression to keep it manageable. To query and write data, it uses an HTTP(S) API. Its performance is noteworthy, standing up the amount of data InfluxDB is capable of handling. It can handle up to a million points of data per second, at a precise level, even to the nanosecond.
- SQL-like queries: If you're familiar with SQL-like syntax, querying data from InfluxDB will feel familiar. It uses its own SQL-like syntax, InfluxQL, for queries. As an example, imagine you're collecting data on used disk space on a machine. If you wanted to see that data, you could write a query that might look like this, which will pull the mean values of used disk space from a three-month period and group them in 10-day increments:
SELECT mean(diskspace_used) as mean_disk_used
FROM disk_stats
WHERE time() >= 3m
GROUP BY time(10d)- Downsampling and data retention: When working with large amounts of data, storing it becomes a concern. Over time, it can accumulate to huge sizes. With InfluxDB, you can downsample into less precise, smaller metrics that you can store for longer periods of time. Data-retention policies enable you to do this. For example, imagine you have sensors collecting data on the amount of RAM in a number of machines. You might collect metrics on the amount of memory in use by multiple users, the system, cached memory, and more. While it might make sense to hang on to that data for 30 days to watch what's happening, after 30 days, you might not need such precise data. Instead, you might only want the ratio of total memory to memory in use. Using data-retention policies, you can tell InfluxDB to hang on to the precise data for all the different usages for 30 days. After 30 days, you can average data to be less precise, and you can hold on to that data for six months, forever, or however long you like. This compromise meets in the middle between keeping historical data and reducing disk usage.
Telegraf
If InfluxDB is where all your data is going, you first need a way to collect and gather the data. Telegraf is a metric collection daemon that gathers various metrics from system components, Internet of Things (IoT) sensors, and more. It's open source and written completely in Go. Like InfluxDB, Telegraf is written by the InfluxData team, and it's built to work with InfluxDB. It also includes support for different databases, such as MySQL/MariaDB, MongoDB, Redis, and more. You can read more about it on InfluxData's website.
Telegraf is modular and heavily based on plugins. This means that Telegraf is as lean and minimal or as full and complex as you need it. Out of the box, it supports more than 100 plugins for various input sources (including Apache, Ceph, Docker, Iptables, Kubernetes, Nginx, and Varnish), processing, and outputs.
Even if you're not using InfluxDB as a data store, you may find Telegraf a useful way to collect data and information about your systems or sensors.
Kapacitor
Now we have a way to collect and store our data. But what about doing things with it? Kapacitor is the piece of the stack that lets you process and work with the data in a few different ways. It supports both stream and batch data. Stream data means you can actively work and shape the data in real time, even before it makes it to your data store. Batch data means you can retroactively perform actions on samples or batches of the data.
One of the biggest pluses for Kapacitor is that it enables real-time alerts for events happening in your environment. CPU usage overloading or temperatures too high? You can set up several different alert systems, including but not limited to email, triggering a command, Slack, HipChat, OpsGenie, and many more. You can see the full list in the documentation.
Like the other TICK stack tools, Kapacitor is open source; you can read more about the project in the README.
Installing the TICK stack
Packages are available for nearly every distribution. You can install these packages from the command line. Use the instructions for your distribution.
Fedora
sudo dnf install https://dl.influxdata.com/influxdb/releases/influxdb-1.3.1.x86_64.rpm \
https://dl.influxdata.com/telegraf/releases/telegraf-1.3.4-1.x86_64.rpm \
https://dl.influxdata.com/kapacitor/releases/kapacitor-1.3.1.x86_64.rpm
CentOS 7/RHEL 7
sudo yum install https://dl.influxdata.com/influxdb/releases/influxdb-1.3.1.x86_64.rpm \
https://dl.influxdata.com/telegraf/releases/telegraf-1.3.4-1.x86_64.rpm \
https://dl.influxdata.com/kapacitor/releases/kapacitor-1.3.1.x86_64.rpm
Ubuntu/Debian
wget https://dl.influxdata.com/influxdb/releases/influxdb_1.3.1_amd64.deb \
https://dl.influxdata.com/telegraf/releases/telegraf_1.3.4-1_amd64.deb \
https://dl.influxdata.com/kapacitor/releases/kapacitor_1.3.1_amd64.deb
sudo dpkg -i influxdb_1.3.1_amd64.deb telegraf_1.3.4-1_amd64.deb kapacitor_1.3.1_amd64.deb
Other distributions
For help with other distributions, see the Downloads page.
See the data, be the data
Now that you have the tools installed, you can experiment with some of them. There's plenty of upstream documentation on all three projects:
Additionally, for more help, you can visit the InfluxData community forums. Happy hacking!


Comments are closed.