Prometheus is an increasingly popular—for good reason—open source tool that provides monitoring and alerting for applications and servers. Prometheus' great strength is in monitoring server-side metrics, which it stores as time-series data. While Prometheus doesn't lend itself to application performance management, active control, or user experience monitoring (although a GitHub extension does make user browser metrics available to Prometheus), its prowess as a monitoring system and ability to achieve high-scalability through a federation of servers make Prometheus a strong choice for a wide variety of use cases.
In this article, we'll take a closer look at Prometheus' architecture and functionality and then examine a detailed instance of the tool in action.
Prometheus architecture and components
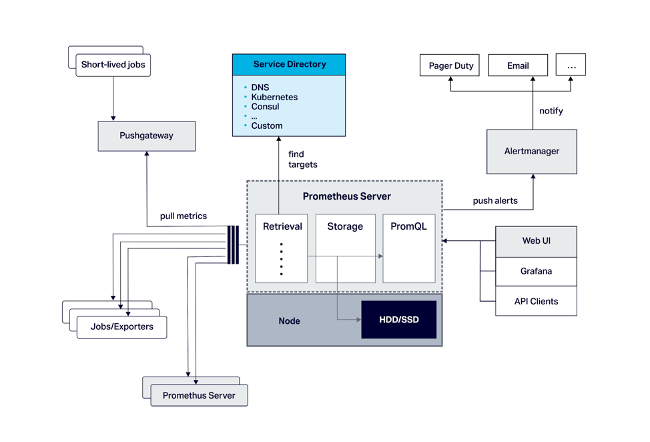
Prometheus consists of the Prometheus server (handling service discovery, metrics retrieval and storage, and time-series data analysis through the PromQL query language), a data model for metrics, a graphing GUI, and native support for Grafana. There is also an optional alert manager that allows users to define alerts via the query language and an optional push gateway for short-term application monitoring. These components are situated as shown in the following diagram.

Prometheus can automatically capture standard metrics by using agents to execute general-purpose code in the application environment. It can also capture custom metrics through instrumentation, placing custom code within the source code of the monitored application. Prometheus officially supports client libraries for Go, Python, Ruby, and Java/Scala and also enables users to write their own libraries. Additionally, many unofficial libraries for other languages are available.
Developers can also utilize third-party exporters to automatically activate instrumentation for many popular software solutions they might be using. For example, users of JVM-based applications like open source Apache Kafka and Apache Cassandra can easily collect metrics by leveraging the existing JMX exporter. In other cases, an exporter won't be needed because the application will expose metrics that are already in the Prometheus format. Those on Cassandra might also find Instaclustr's freely available Cassandra Exporter for Prometheus to be helpful, as it integrates Cassandra metrics from a self-managed cluster into Prometheus application monitoring.
Also important: Developers can leverage an available node exporter to monitor kernel metrics and host hardware. Prometheus offers a Java client as well, with a number of features that can be registered either piecemeal or at once through a single DefaultExports.initialize(); command—including memory pools, garbage collection, JMX, classloading, and thread counts.
Prometheus data modeling and metrics
Prometheus provides four metric types:
- Counter: Counts incrementing values; a restart can return these values to zero
- Gauge: Tracks metrics that can go up and down
- Histogram: Observes data according to specified response sizes or durations and counts the sums of observed values along with counts in configurable buckets
- Summary: Counts observed data similar to a histogram and offers configurable quantiles that are calculated over a sliding time window
Prometheus time-series data metrics each include a string name, which follows a naming convention to include the name of the monitored data subject, the logical type, and the units of measure used. Each metric includes streams of 64-bit float value that are timestamped down to the millisecond, and a set of key:value pairs labeling the dimensions it measures. Prometheus automatically adds Job and Instance labels to each metric to keep track of the configured job name of the data target and the <host>:<port> piece of the scraped target URL, respectively.
Prometheus example: the Anomalia Machina anomaly detection experiment
Before moving into the example, download and begin using open source Prometheus by following this getting started guide.
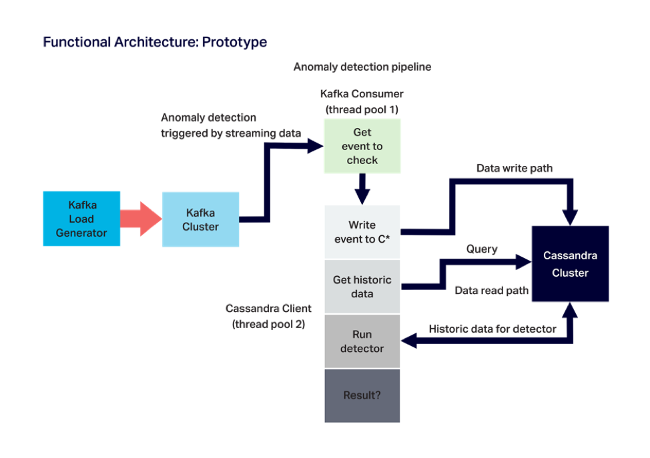
To demonstrate how to put Prometheus into action and perform application monitoring at a high scale, let's take a look at a recent experimental Anomalia Machina project we completed at Instaclustr. This project—just a test case, not a commercially available solution—leverages Kafka and Cassandra in an application deployed by Kubernetes, which performs anomaly detection on streaming data. (Such detection is critical to use cases including IoT applications and digital ad fraud, among other areas.) The experimental application relies heavily on Prometheus to collect application metrics across distributed instances and make them readily available to view.
This diagram displays the experiment's architecture:

Our goals in utilizing Prometheus included monitoring the application's more generic metrics, such as throughput, as well as the response times delivered by the Kafka load generator (the Kafka producer), the Kafka consumer, and the Cassandra client tasked with detecting any anomalies in the data. Prometheus monitors the system's hardware metrics as well, such as the CPU for each AWS EC2 instance running the application. The project also counts on Prometheus to monitor application-specific metrics such as the total number of rows each Cassandra read returns and, crucially, the number of anomalies it detects. All of this monitoring is centralized for simplicity.
In practice, this means forming a test pipeline with producer, consumer, and detector methods, as well as the following three metrics:
- A counter metric, called prometheusTest_requests_total, increments each time that each pipeline stage executes without incident, while a stage label allows for tracking the successful execution of each stage, and a total label tracks the total pipeline count.
- Another counter metric, called prometheusTest_anomalies_total, counts any detected anomalies.
- Finally, a gauge metric called prometheusTest_duration_seconds tracks the seconds of duration for each stage (again using a stage label and a total label).
The code behind these measurements increments counter metrics using the inc() method and sets the time value of the gauge metric with the setToTime() method. This is demonstrated in the following annotated example code:
import java.io.IOException;
import io.prometheus.client.Counter;
import io.prometheus.client.Gauge;
import io.prometheus.client.exporter.HTTPServer;
import io.prometheus.client.hotspot.DefaultExports;

// https://github.com/prometheus/client_java
// Demo of how we plan to use Prometheus Java client to instrument Anomalia Machina.
// Note that the Anomalia Machina application will have Kafka Producer and Kafka consumer and rest of pipeline running in multiple separate processes/instances.
// So metrics from each will have different host/port combinations.
public class PrometheusBlog {
static String appName = "prometheusTest";
// counters can only increase in value (until process restart)
// Execution count. Use a single Counter for all stages of the pipeline, stages are distinguished by labels
static final Counter pipelineCounter = Counter.build()
    .name(appName + "_requests_total").help("Count of executions of pipeline stages")
    .labelNames("stage")
    .register();
// in theory could also use pipelineCounter to count anomalies found using another label
// but less potential for confusion having another counter. Doesn't need a label
static final Counter anomalyCounter = Counter.build()
    .name(appName + "_anomalies_total").help("Count of anomalies detected")
    .register();
// A Gauge can go up and down, and is used to measure current value of some variable.
// pipelineGauge will measure duration in seconds of each stage using labels.
static final Gauge pipelineGauge = Gauge.build()
    .name(appName + "_duration_seconds").help("Gauge of stage durations in seconds")
    .labelNames("stage")
    .register();

public static void main(String[] args) {
// Allow default JVM metrics to be exported
   DefaultExports.initialize();

   // Metrics are pulled by Prometheus, create an HTTP server as the endpoint
   // Note if there are multiple processes running on the same server need to change port number.
   // And add all IPs and port numbers to the Prometheus configuration file.
HTTPServer server = null;
try {
server = new HTTPServer(1234);
} catch (IOException e) {
e.printStackTrace();
}
// now run 1000 executions of the complete pipeline with random time delays and increasing rate
int max = 1000;
for (int i=0; i < max; i++)
{
// total time for complete pipeline, and increment anomalyCounter
pipelineGauge.labels("total").setToTime(() -> {
producer();
consumer();
if (detector())
anomalyCounter.inc();
});
// total pipeline count
pipelineCounter.labels("total").inc();
System.out.println("i=" + i);

// increase the rate of execution
try {
Thread.sleep(max-i);
} catch (InterruptedException e) {
e.printStackTrace();
}
}
server.stop();
}
// the 3 stages of the pipeline, for each we increase the stage counter and set the Gauge duration time
public  static void producer() {
class Local {};
String name = Local.class.getEnclosingMethod().getName();
pipelineGauge.labels(name).setToTime(() -> {
try {
Thread.sleep(1 + (long)(Math.random()*20));
} catch (InterruptedException e) {
e.printStackTrace();
}
});
pipelineCounter.labels(name).inc();
   }
public  static void consumer() {
class Local {};
String name = Local.class.getEnclosingMethod().getName();
pipelineGauge.labels(name).setToTime(() -> {
try {
Thread.sleep(1 + (long)(Math.random()*10));
} catch (InterruptedException e) {
e.printStackTrace();
}
});
pipelineCounter.labels(name).inc();
   }
// detector returns true if anomaly detected else false
public  static boolean detector() {
class Local {};
String name = Local.class.getEnclosingMethod().getName();
pipelineGauge.labels(name).setToTime(() -> {
try {
Thread.sleep(1 + (long)(Math.random()*200));
} catch (InterruptedException e) {
e.printStackTrace();
}
});
pipelineCounter.labels(name).inc();
return (Math.random() > 0.95);
   }
}
Prometheus collects metrics by polling ("scraping") instrumented code (unlike some other monitoring solutions that receive metrics via push methods). The code example above creates a required HTTP server on port 1234 so that Prometheus can scrape metrics as needed.
The following sample code addresses Maven dependencies:
<!-- The client -->
<dependency>
 <groupId>io.prometheus</groupId>
 <artifactId>simpleclient</artifactId>
 <version>LATEST</version>
</dependency>
<!-- Hotspot JVM metrics-->
<dependency>
 <groupId>io.prometheus</groupId>
 <artifactId>simpleclient_hotspot</artifactId>
 <version>LATEST</version>
</dependency>
<!-- Exposition HTTPServer-->
<dependency>
 <groupId>io.prometheus</groupId>
 <artifactId>simpleclient_httpserver</artifactId>
 <version>LATEST</version>
</dependency>
<!-- Pushgateway exposition-->
<dependency>
 <groupId>io.prometheus</groupId>
 <artifactId>simpleclient_pushgateway</artifactId>
 <version>LATEST</version>
</dependency>
The code example below tells Prometheus where it should look to scrape metrics. This code can simply be added to the configuration file (default: Prometheus.yml) for basic deployments and tests.
global:
 scrape_interval:     15s # By default, scrape targets every 15 seconds.

# scrape_configs has jobs and targets to scrape for each.
scrape_configs:
 # job 1 is for testing prometheus instrumentation from multiple application processes.
 # The job name is added as a label job=<job_name> to any timeseries scraped from this config.
 - job_name: 'testprometheus'

   # Override the global default and scrape targets from this job every 5 seconds.
   scrape_interval: 5s

   # this is where to put multiple targets, e.g. for Kafka load generators and detectors
   static_configs:
     - targets: ['localhost:1234', 'localhost:1235']

 # job 2 provides operating system metrics (e.g. CPU, memory etc).
 - job_name: 'node'

  # Override the global default and scrape targets from this job every 5 seconds.
   scrape_interval: 5s

   static_configs:
     - targets: ['localhost:9100']
Note the job named "node" that uses port 9100 in this configuration file; this job offers node metrics and requires running the Prometheus node exporter on the same server where the application is running. Polling for metrics should be done with care: doing it too often can overload applications, too infrequently can result in lag. Where application metrics can't be polled, Prometheus also offers a push gateway.
Viewing Prometheus metrics and results
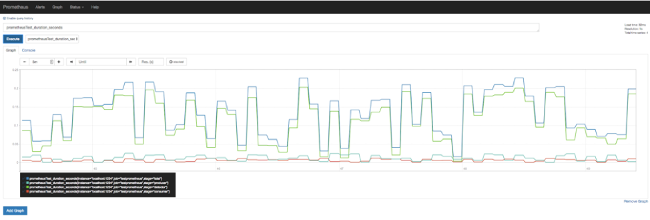
Our experiment initially used expressions, and later Grafana, to visualize data and overcome Prometheus' lack of default dashboards. Using the Prometheus interface (or https://localhost:9090/metrics), select metrics by name and then enter them in the expression box for execution. (Note that it's common to experience error messages at this stage, so don't be discouraged if you encounter a few issues.) With correctly functioning expressions, results will be available for display in tables or graphs as appropriate.
Using the irate or rate function on a counter metric will produce a useful rate graph:

Here is a similar graph of a gauge metric:

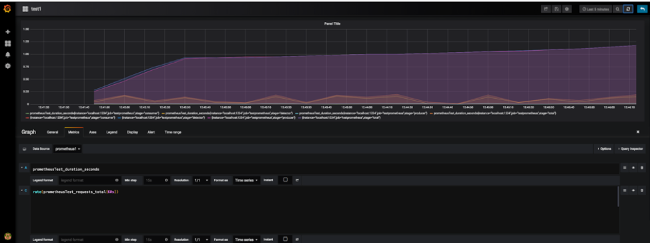
Grafana provides much more robust graphing capabilities and built-in Prometheus support with graphs able to display multiple metrics:

To enable Grafana, install it, navigate to https://localhost:3000/, create a Prometheus data source, and add a Prometheus graph using an expression. A note here: An empty graph often points to a time range issue, which can usually be solved by using the "Last 5 minutes" setting.
Creating this experimental application offered an excellent opportunity to build our knowledge of what Prometheus is capable of and resulted in a high-scale experimental production application that can monitor 19 billion real-time data events for anomalies each day. By following this guide and our example, hopefully, more developers can successfully put Prometheus into practice.


4 Comments