

In my previous article, I provided an overview of possible community health metrics. I look at what you can do with those metrics in this article. You'll see several examples from different communities, some of which you may be familiar with.
Contribution metric
I'll start with the "new contributors and contributions" metric, which measures developers joining and leaving a community. I can measure this by seeing which developers made a commit during a specific period. Someone who shows up for the first time joined. Someone who hasn't contributed for a while has probably left.
It is natural for developers to leave a project. Maybe they change jobs, have a change in priorities, or have personal reasons for reducing their open source engagement. It is important for the health of an open source project to attract new developers to continue the work.
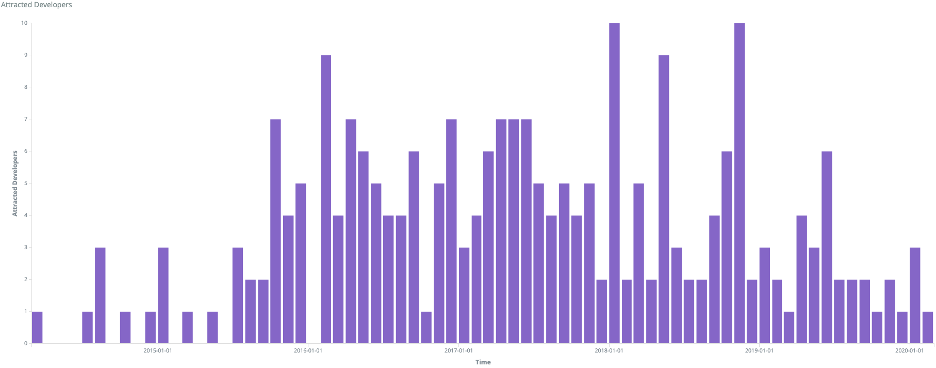
The first example is taken from a 2020 community report looking at the Mautic community over the previous five years.
When considering the Mautic product repository, you can see that there has been a steady rate of new developers contributing to Mautic this quarter. New developers are defined here as having made their first commit which was merged in the given period.
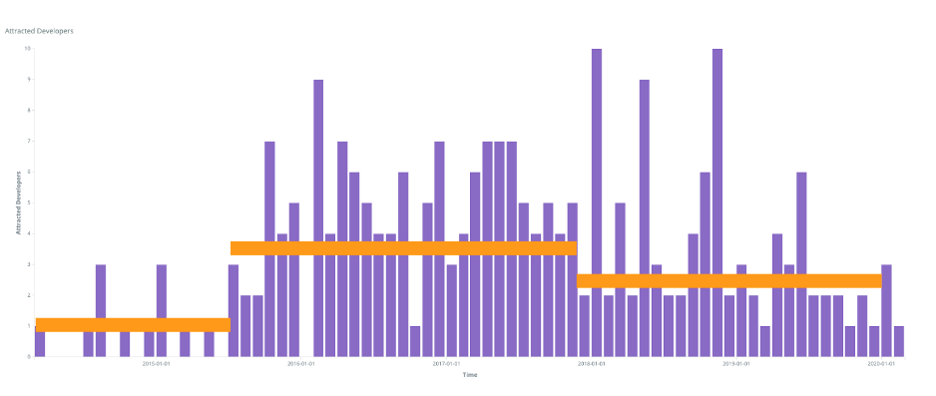
I added lines to show the community attracting new contributors at various rates over different periods. This reflects the different stages of the community over these five years and the strategic decisions made.
A single metric by itself, however, is not fully descriptive of community health. The Mautic Community Report continued to also look at the overall contributions made.
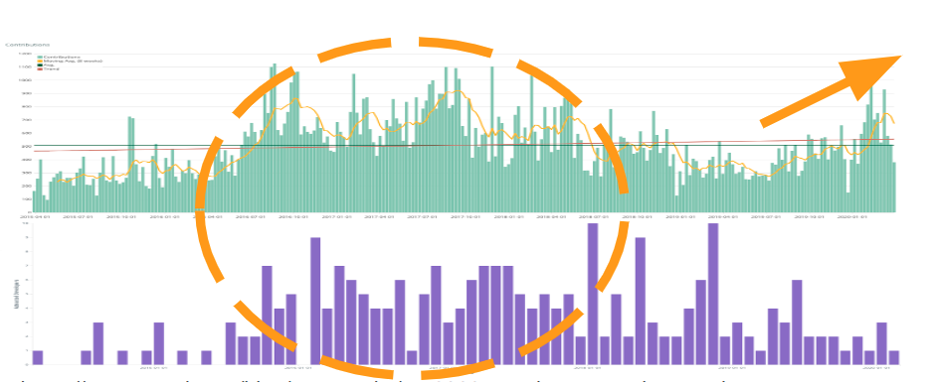
The overall contributions were elevated during the period of increased attraction of new contributors, shown here in the dashed circle. After a downward spiral, the community became more active towards the end of this analysis period.
Draw conclusions
Q1 2020 was a busy one in the Mautic community. Many positive steps were taken to establish a solid foundation for growth. Teams became more proactive and processes were established that helped the community function more effectively. You see a significant increase in engagement and new contributors as a result.
Organizational diversity metric
Now, look at the metric "Organizational Diversity." Similar to how a project is healthy when many different contributors are working on it, it is good to have several organizations involved, too.
To make this case, think of a community where a single organization employs all contributors. If that organization decides to reduce its project efforts and reassign the contributors, the project would be in jeopardy. This is why communities are interested in the organizational diversity of their contributors.
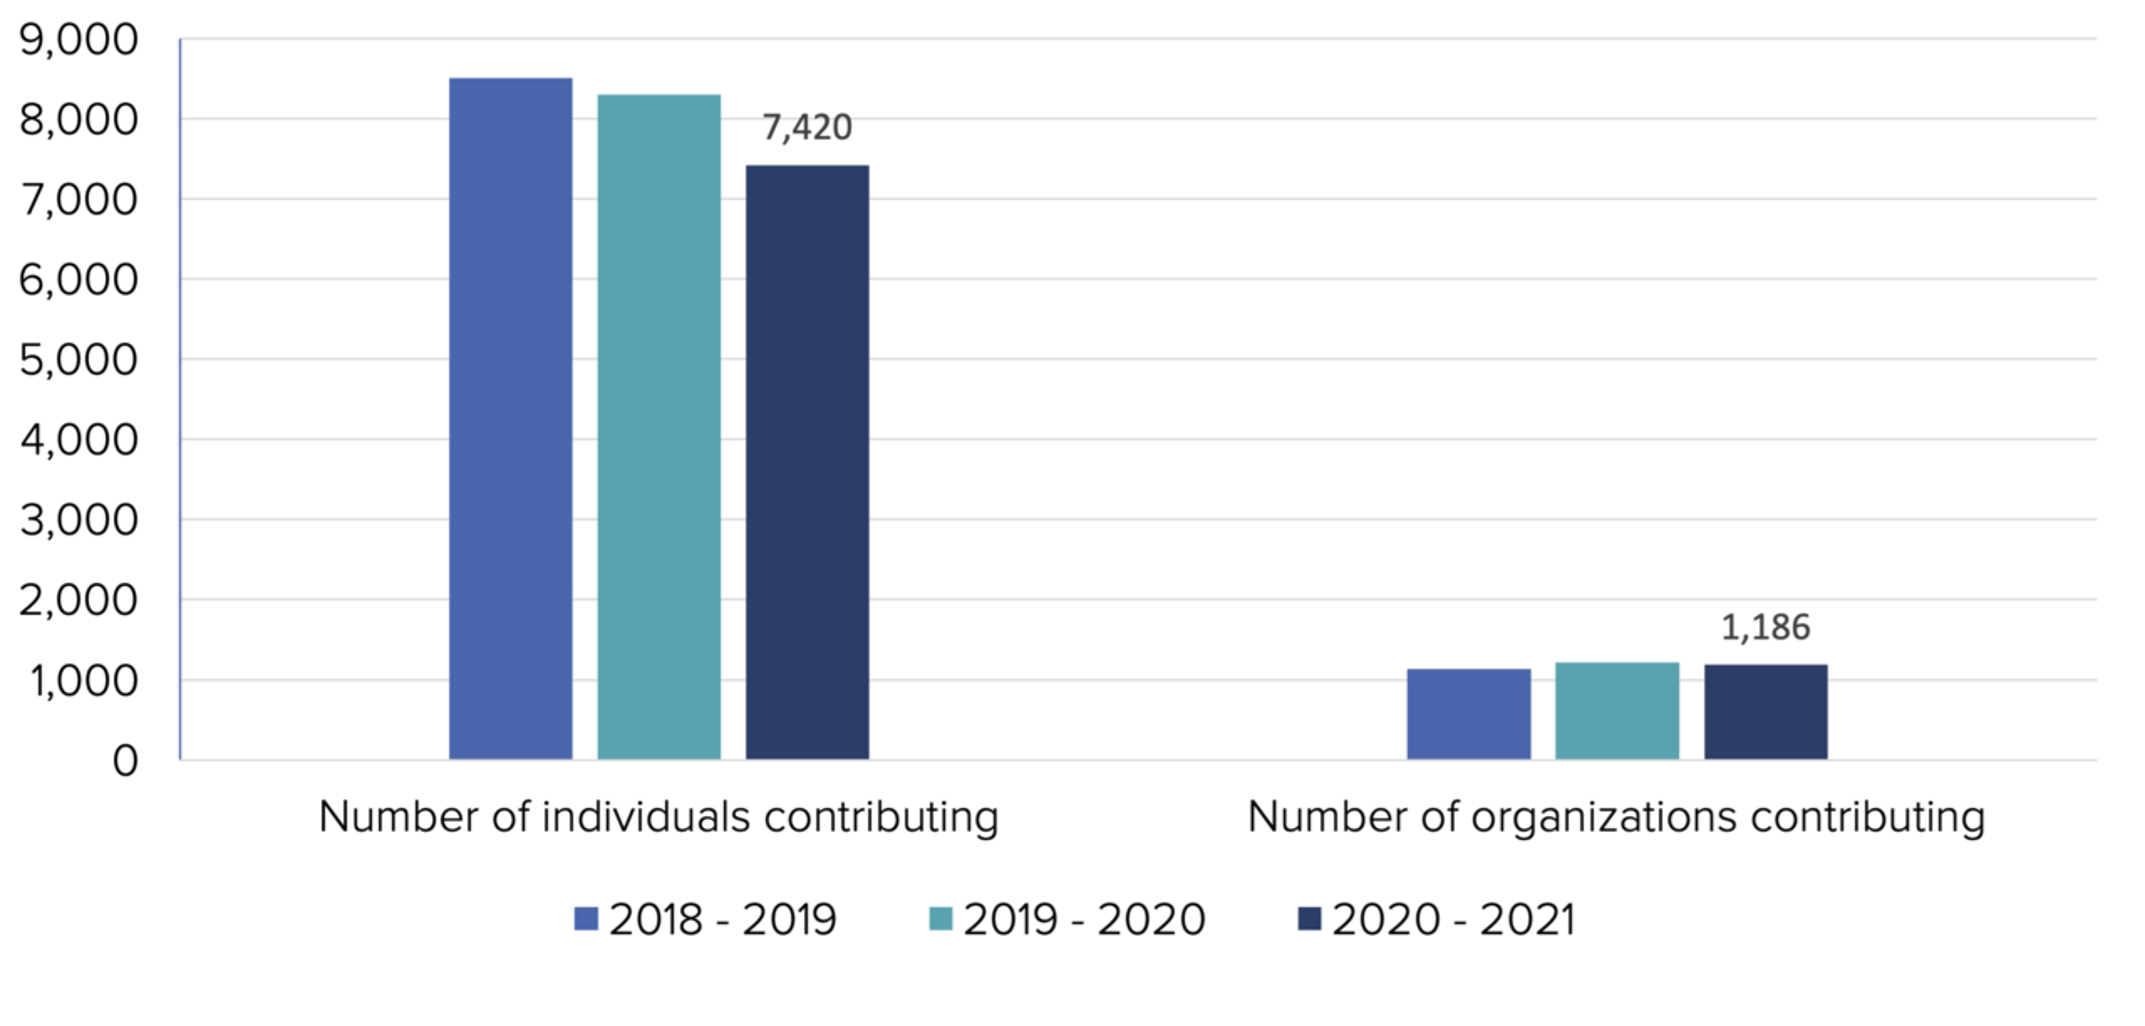
(Images source: https://dri.es/who-sponsors-drupal-development-2021)
One entity that regularly reports on its organizational diversity is the Drupal community. In fact, the Drupal community has a sophisticated credit system for tracking contributions and associating them with organizations. Contributors can declare whether they have contributed as a volunteer, part of their employment, or in client work for a specific customer.
In the 12 months between July 1, 2020, and June 30, 2021, Drupal.org's credit system recorded contributions from 7,420 different individuals and 1,186 different organizations. It saw a 10% decline in individual contributors but only a 2% decrease in organizational contributors.
This is the time of the COVID pandemic. While the economic situation for many wasn't good, the fact that most organizations continued to support Drupal tells us they would again increase their contributions when the economy recovered. This data was a sign of community health.
Who is making contributions?
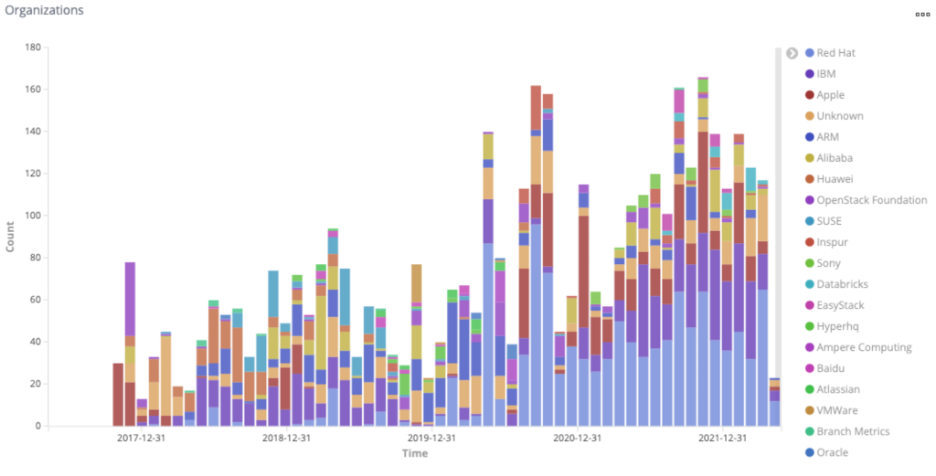
(Georg Link and Emilio Galeano Gryciuk, CC BY-SA 4.0)
I'll look at other Contributions by Organizations. In this graph from the kata containers community, I excluded two founding member organizations. Their declared goal with open sourcing kata containers was to build a healthy and vibrant community supported by many organizations. This graph shows the number of commits done by these non-founding members, and you see a steady increase over five years. This shows the success of engaging more companies to make contributions. As more organizations get involved, the graph also becomes more colorful.
Contributor experience metric
So far, I discussed metrics that showed information about who is involved in an open source project and how engaged they were. The level of engagement is important because a community would be dead without it.
Another area of community health is the experience that community members have when contributing. Imagine trying to contribute to a community, opening an issue, and no one responds—how would you feel? Would you go on to create a change request? What if you already made a change request, and no one commented on it or reviewed it? Wouldn't you prefer to at least hear something, even if it was, "Thank you, but this is out of scope, and we won't merge it"?
Consider change requests metrics: Change requests are intended to be reviewed by other developers, who may suggest improvements. In the CHAOSS project, members decided to use the vendor-neutral term "change request" because GitHub, GitLab, and Gerrit all called it something different.
- Pull Request (GitHub)
- Merge Request (GitLab)
- Changeset (Gerrit)
(Georg Link and Emilio Galeano Gryciuk, CC BY-SA 4.0)
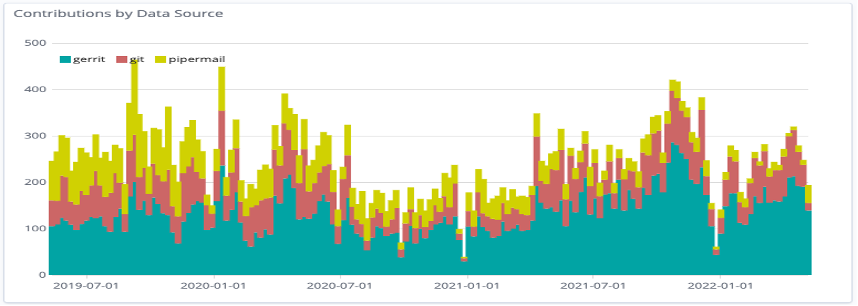
(Georg Link and Emilio Galeano Gryciuk, CC BY-SA 4.0)
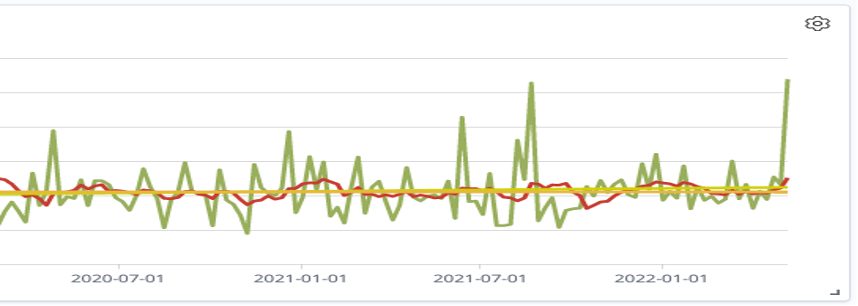
For example, the Starling X community has a 3.97-day Median Time to Merge (another name for Change Request Duration). The metric itself sounds good. When you contribute, the work is done within four days.
I want to put this metric into more context. You see that the overall contributions dropped off during the pandemic. However, when you look at the review efficiency index, you see that the responsiveness was good. The experience of contributors was good, albeit at a lower level during the pandemic, and they responded to each other well, even during stressful situations.
The answer is sometimes the question
Measurable data causes some people to fool themselves into thinking it's a puzzle that needs to fit together perfectly into a complete picture. But often, reviewing the data, questioning the results of community programs, inventing new solutions to problems you detect, and asking questions that drive you toward a healthier community is exactly what you should be doing with your data.
The data about your community will never stop changing, and that's to be expected. It is important to gather, look at, and take action on data when you identify weaknesses, biases, or things you've neglected.
You can build a healthier community, and a healthier community is empowered to make better software.


Comments are closed.