

I love working with spreadsheets, and my favorite spreadsheet application is LibreOffice Calc. A spreadsheet is a grid of cells where each column is represented by letters and rows are numbered. You can perform all kinds of calculations using a spreadsheet. If you can perform a calculation based on other values, you can do that in a spreadsheet.
Here I illustrate how to use the LibreOffice Calc spreadsheet to perform a particular calculation called the Fibonacci Sequence. Fibonacci Sequence numbers pop up everywhere in mathematics and the sciences and are often used to model a simple population growth.
The magic bunny
Imagine a baby bunny who has moved into a new forest home. The forest is empty of all other bunnies; the bunny is alone. But this is a magic bunny — it is born pregnant, and all its children will also be born pregnant. Rabbits breed quickly, but especially so for this breed of magic bunny, which produces a new generation every year.
Let's call the year before the bunny arrived "year zero" or "iteration zero," when you had zero bunnies. A year later, you are at "year one" or "iteration one," with our first bunny.
The population of our magic bunny grows in this way: A baby bunny grows into an adult bunny after one year. An adult bunny will remain into the next generation but will produce another baby bunny. In other words, the rules for counting the bunny population are:
-
baby bunny (b) → adult bunny (A)
-
adult bunny (A) → adult bunny (A) plus a baby bunny (b)
Over time, the bunny population grows like this:
| Iteration | Population | Count |
| 0 | - | 0 |
| 1 | b | 1 |
| 2 | A | 1 |
| 3 | Ab | 2 |
| 4 | AbA | 3 |
As you can see, the bunny population grows very quickly. The forest will quickly be filled with magic bunnies.
Counting bunnies in a spreadsheet
How many bunnies will there be after five, ten, or 20 years? Looking at each iteration, the number of bunnies in any year is the sum of the previous two years. Fibonacci described this growth using this definition:
Fib(n) = Fib(n-1) + Fib(n-2)
and:
Fib(0) = 0
Fib(1) = 1
You can calculate this using LibreOffice Calc! Here's how.
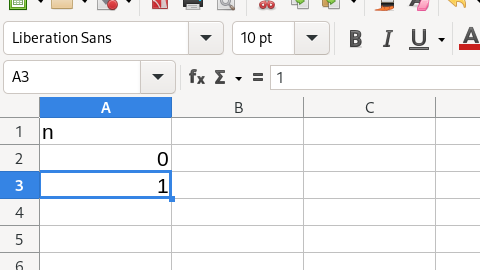
Start with an empty spreadsheet and enter the first two iterations: 0 and 1. Label these with a column header called "n." To enter this into LibreOffice Calc, type "n" into cell A1, the value 0 in cell A2, and 1 in cell A3:
(Jim Hall, CC BY-SA 4.0)
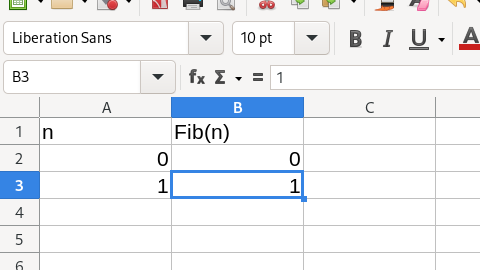
Enter the first two iterations of the magic bunny. In year zero, there were zero bunnies. In year one, there was one bunny. You can write that mathematically as Fib(0) = 0 and Fib(1) = 1. You can label this with a column header called "Fib(n)." Enter this into LibreOffice Calc by typing "Fib(n)" into cell B1, the number 0 in cell B2, and 1 in cell B3:
(Jim Hall, CC BY-SA 4.0)
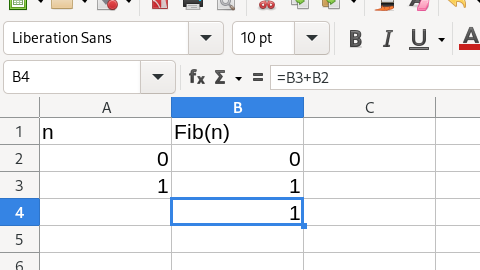
To calculate the bunny population in the next iteration, use a spreadsheet formula to calculate Fib(n) for year two. Since the count in any year is the sum of the counts of the previous two years, you can enter into cell B4 the spreadsheet formula =B3+B2. This is the sum of B3 and B2 using addition. LibreOffice Calc will perform the calculation and enter the final result into cell B4:
(Jim Hall, CC BY-SA 4.0)
Use AutoFill to calculate future generations
Having entered the first few "n" and "Fib(n)" values, and the calculation for the next iteration, you can let LibreOffice Calc do the rest of the calculations. Notice that when you click on each cell in the spreadsheet, the cell outline has a small box in the lower-right corner. You can grab this box with your mouse and "stretch" the box to fill other cells in the spreadsheet.
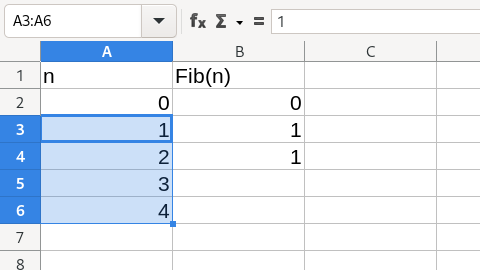
When you stretch a cell to fill other cells, LibreOffice Calc uses a feature called "AutoFill" to enter values into the new cells. If you stretch a cell with a single value, AutoFill will iterate the number by one until it reaches the end of the series. For example, you can stretch cell A3 to fill other cells below it, which will fill the range with 2, 3, 4, and so on:
(Jim Hall, CC BY-SA 4.0)
If you stretch a cell that has a calculation in it, LibreOffice Calc will try to extend the calculation for you. For example, if you stretch your calculation in B4 into cell B5, the new B5 will contain the formula =B4+B3. In other words, AutoFill translates the calculation. Each successive Fib(n) calculation will be the sum of the two cells above it:
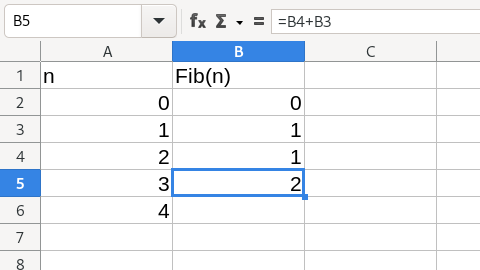
(Jim Hall, CC BY-SA 4.0)
You can continue to stretch the cells down, and AutoFill will continue the calculations:
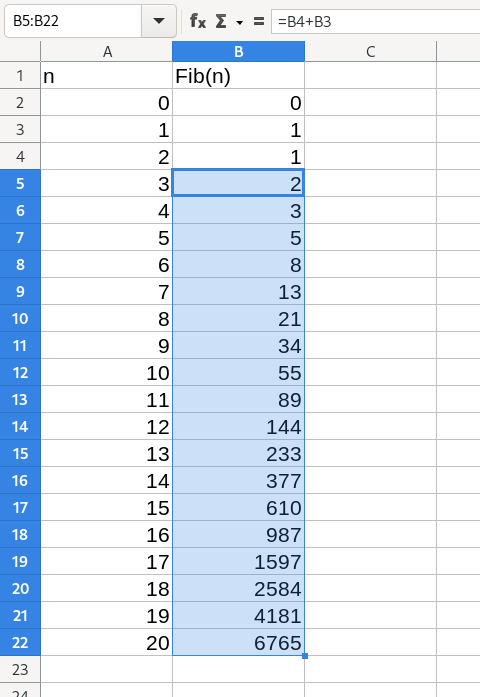
(Jim Hall, CC BY-SA 4.0)
So you learn that after 20 iterations, you will have 6,765 magic bunnies. That's a lot of bunnies! Over 6,000 bunnies in 20 years represent a very fast population growth, but it demonstrates how quickly the Fibonacci Sequence can add up to a forest full of magic bunnies. The calculation is relatively simple using LibreOffice Calc.


Comments are closed.