

Open source tools have been instrumental in advancing technology and making it more accessible to everyone. Data analysis is no exception. As data becomes more abundant and complex, data scientists always look for ways to simplify their workflow and create interactive and engaging visualizations. PyGWalker is designed to solve such problems.
PyGWalker (Python binding of Graphic Walker) connects a working environment of Python Jupyter Notebook to Graphic Walker to create an open source data visualization tool. You can turn your Pandas dataframe into a beautifully crafted data visualization with simple drag-and-drop operations.
(Bill Wang, CC BY-SA 4.0)
Get started with PyGWalker
Use pip to install PyGWalker:
$ python3 -m pip install pygwalkerImport pygwalker and pandas to use it in a project:
import pandas as pd
import pygwalker as pyg
Load data into a Pandas datagram and call PyGWalker:
df = pd.read\_csv('./bike\_sharing\_dc.csv', parse\_dates=\['date'\])
gwalker = pyg.walk(df)
You now have a graphical UI to explore and visualize your Pandas dataframe!
Explore data with Graphic Walker
One of the key features of Graphic Walker is the ability to change mark types to create different kinds of charts. For example, create a line chart by changing the mark type to a line.
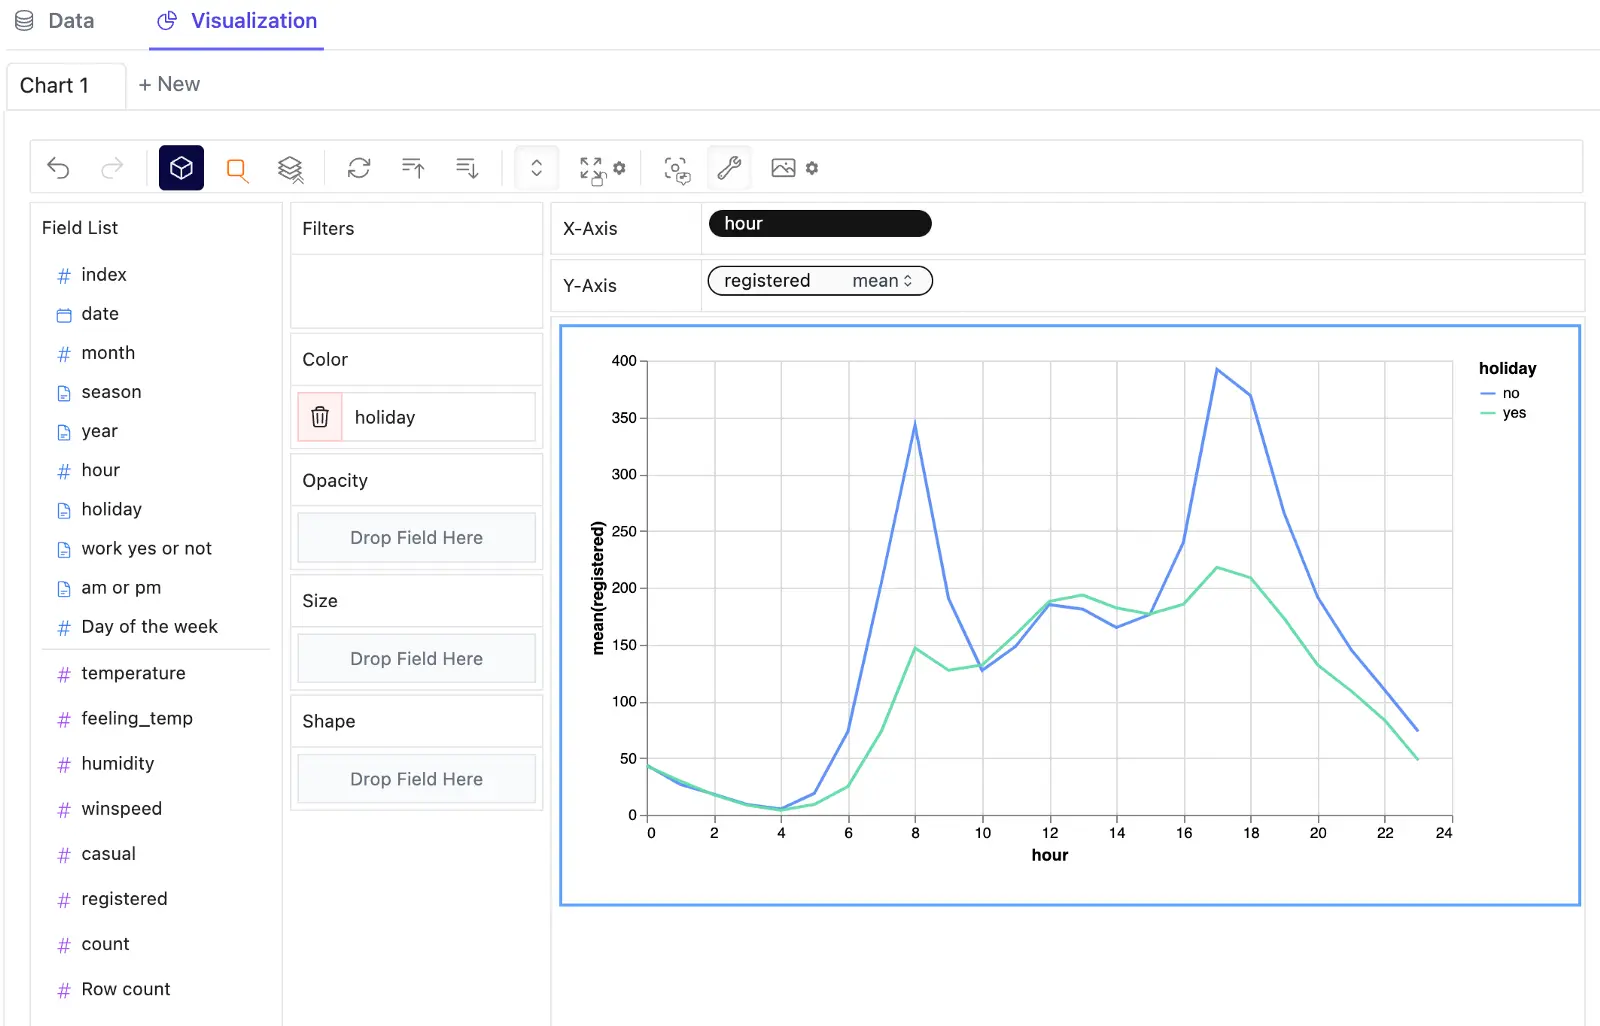
(Bill Wang, CC BY-SA 4.0)
You can also compare different measures by creating a concat view, which adds more than one measure into rows and columns.
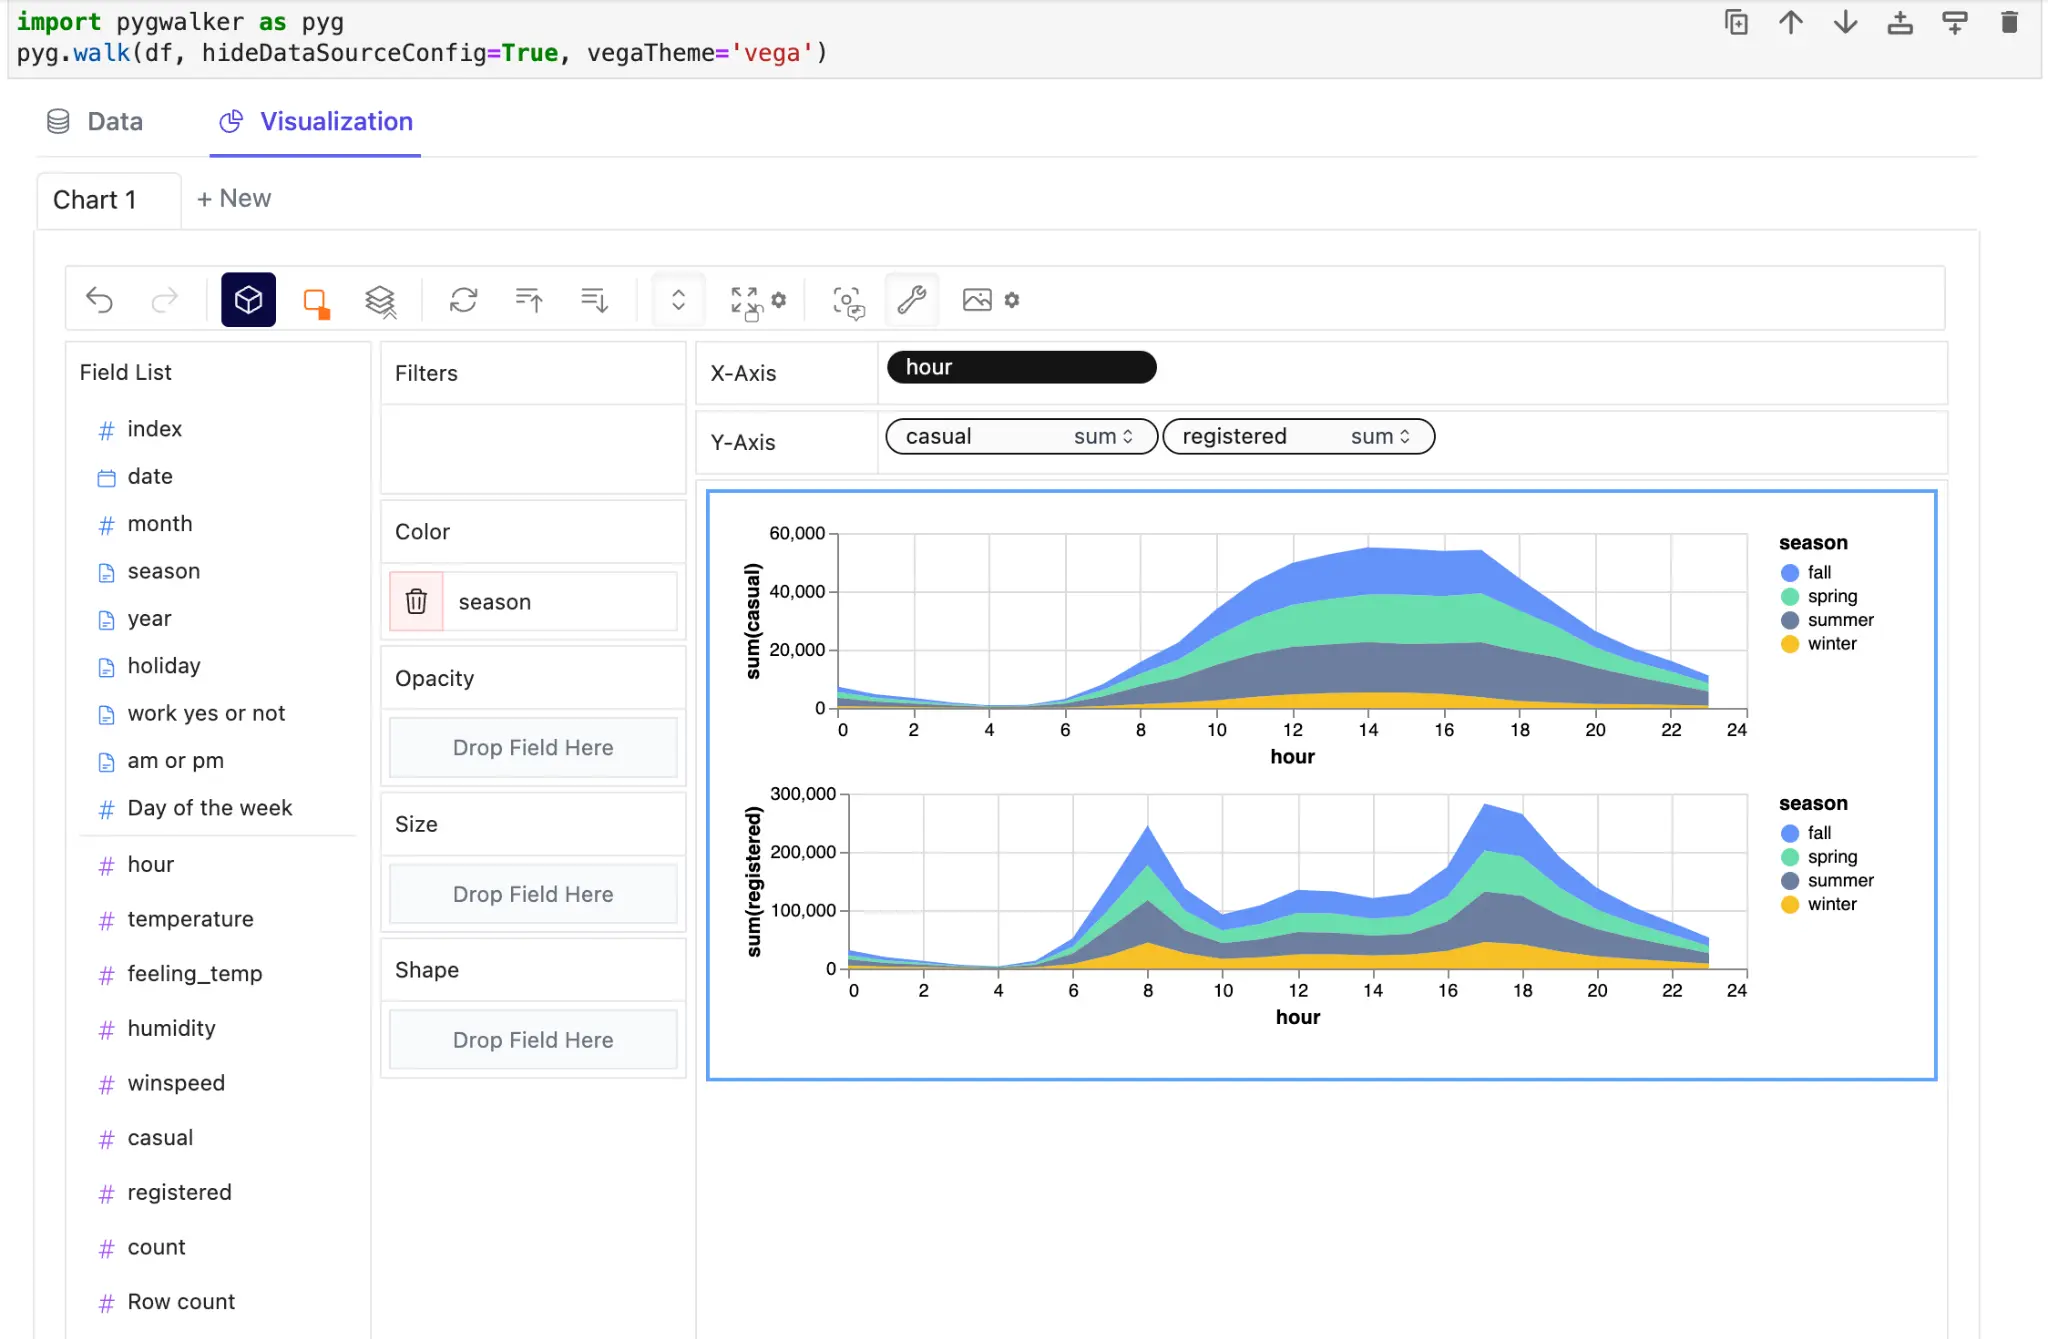
(Bill Wang, CC BY-SA 4.0)
Put dimensions into rows or columns to create a facet view of several subviews divided by the value in a dimension.
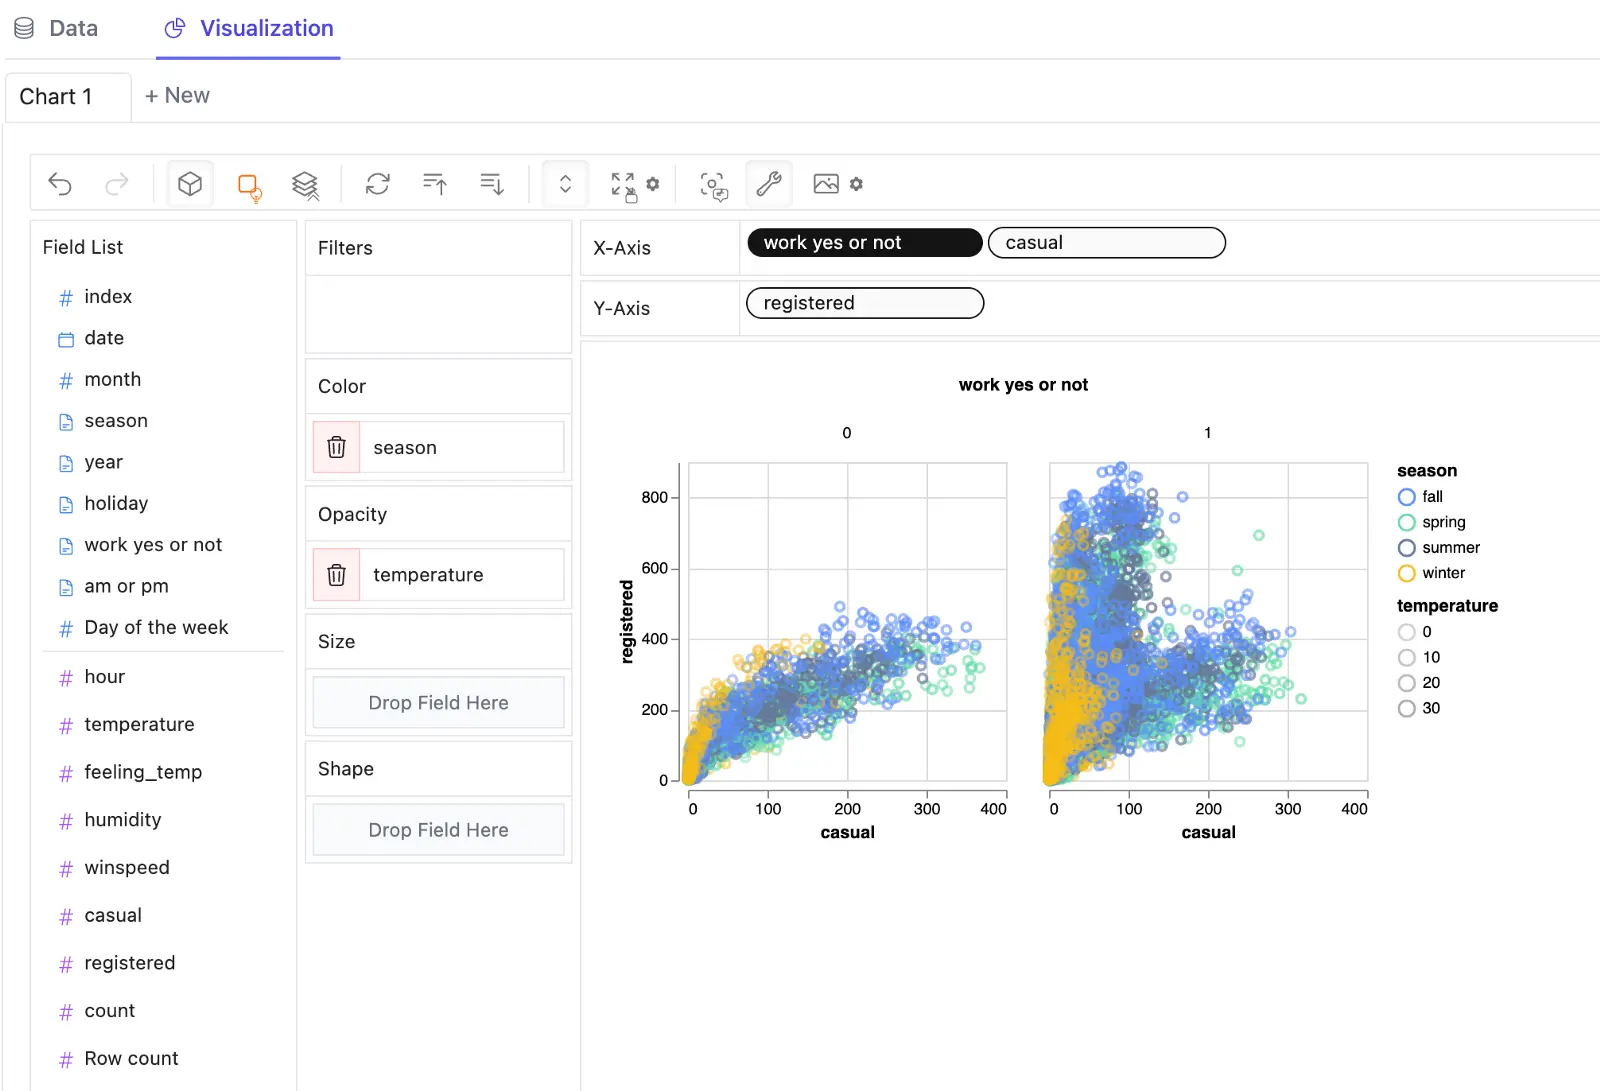
(Bill Wang, CC BY-SA 4.0)
In the Data tab, you can view the data frame in a table and configure the analytic and semantic types.
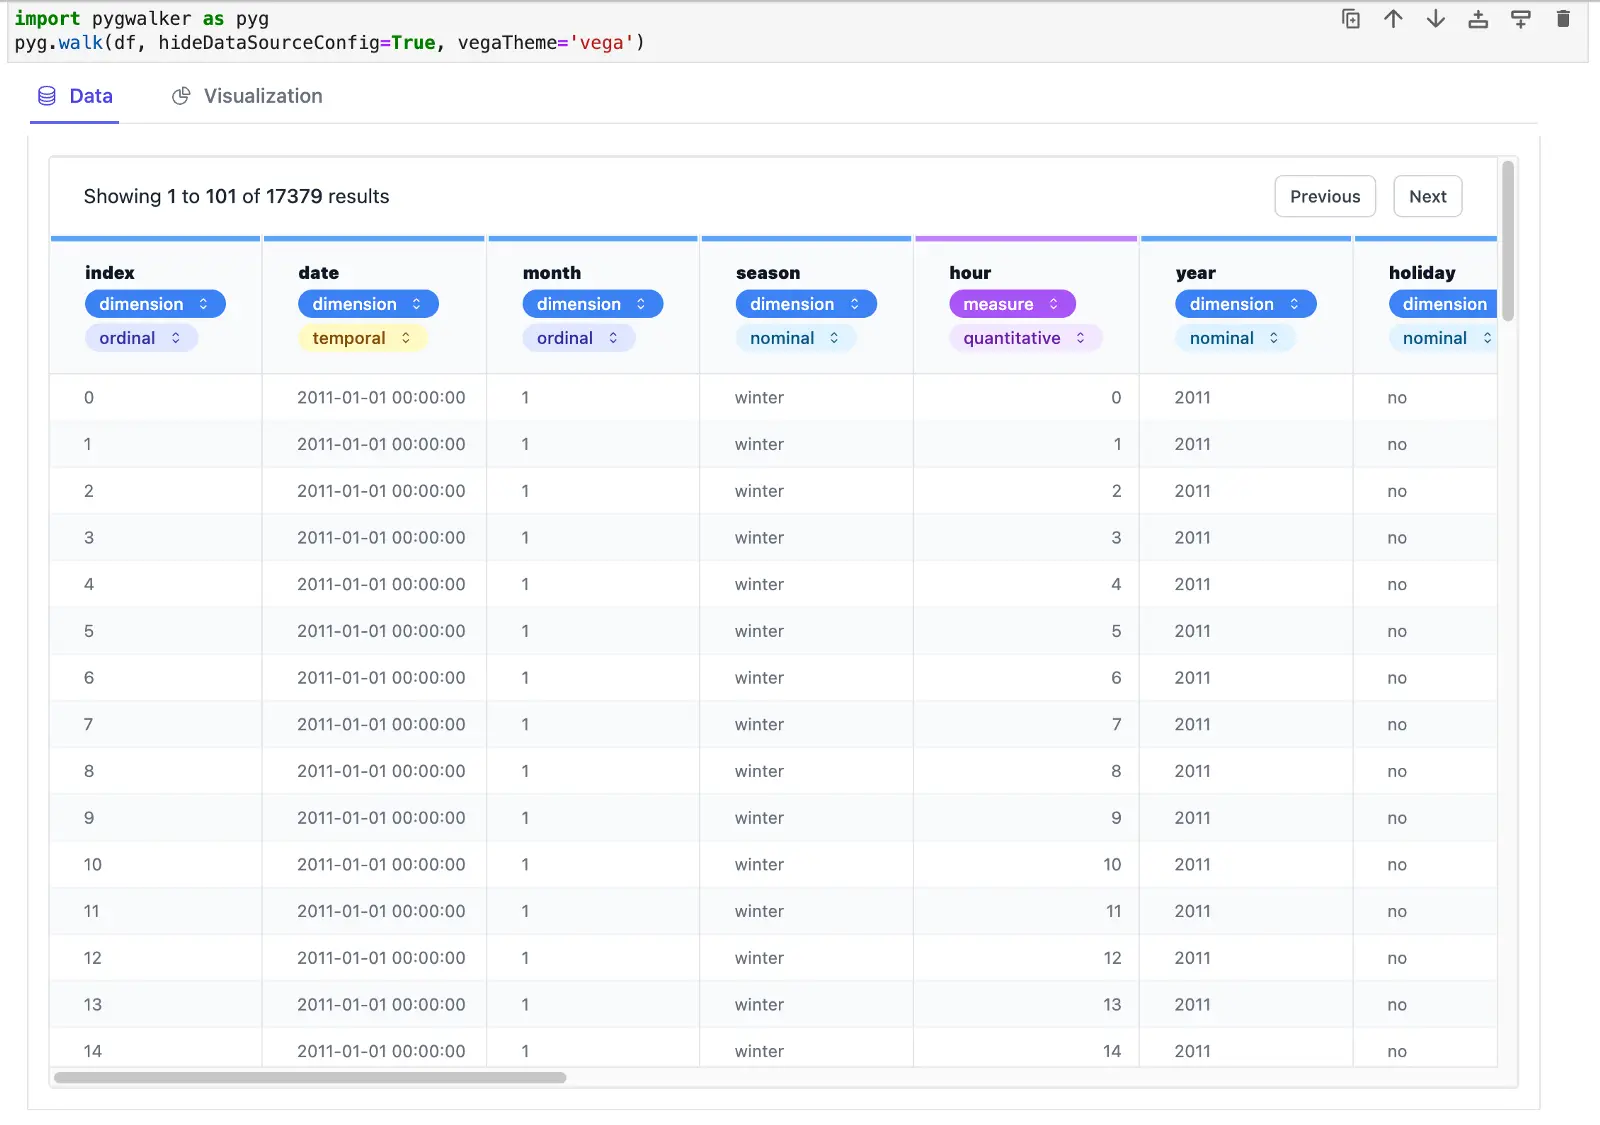
(Bill Wang, CC BY-SA 4.0)
Data exploration with PyGWalker
You can turn your Pandas data into graphical and highly-customizable charts with PyGWalker. You can also use PyGWalker as a powerful tool for exploring data to uncover underlying patterns, trends, and insights.
Data exploration options are available in the Exploration Mode option (in the toolbar). They can be set to either Point Mode or Brush Mode.
- Point Mode: Explore data by pointing your mouse cursor at a specific segment of the data.
- Brush Mode: Explore data by drawing a selection box around a range of data and then drag it to see generated insights.
Try this to see your data
You can try PyGWalker on these cloud demos: Google Colab, Binder, or Graphic Walker Online Demo.
PyGWalker is an excellent tool for simplifying data analysis and visualization workflows, particularly for those who want a visual interface for Pandas. With PyGWalker and Graphic Walker, data scientists can easily create stunning visualizations with simple drag-and-drop operations in Jupyter Notebook. Check out the PyGWalker Git repository for the source code.
For data scientists who seek an open source solution to automated data exploration and advanced augmented analytics, the project also works on RATH, an open source auto-EDA, AI-empowered data exploration and visualization tool. You can also check out the RATH Git repository for the source code and an active community.


Comments are closed.