Stuttgart, Germany has, like many other cities, a smog problem—even if it may be less severe than in other cities. The European Union has defined a threshold of on average 50 micrograms of dust particles per cubic meter in a 24-hour window of air to be allowed for a maximum of 35 days a year. For the last few years, actual values have been much higher for more than 35 days. There are governmental stations that measure the air pollution, but they can’t be everywhere for obvious reasons.
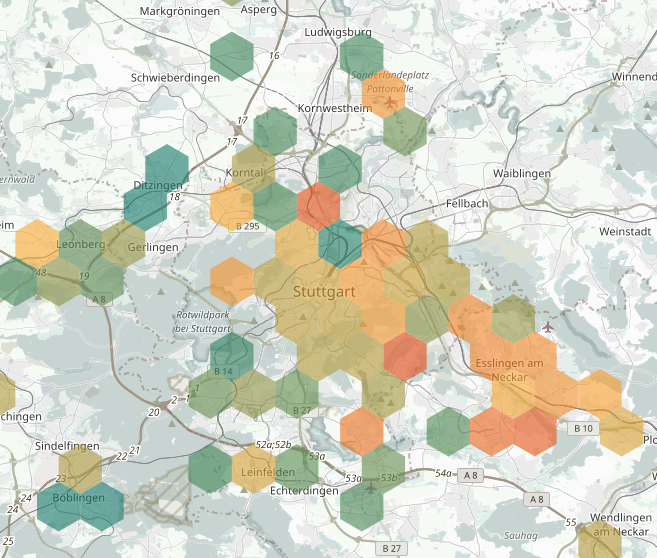
The Open Knowledge Lab in Stuttgart, Germany has begun to develop their own IoT sensors that measure air quality every minute and report the data to a central server. It is then possible to display the smog levels on a map. See the map we're using.
Note: Analyzers are capable of counting particles with 10µm in diameter as well as 2.5µm; they are called PM 10 and PM 2.5, respectively. Local thresholds take the particle size into account. Learn more on the Wikipedia entry on particulates.

Map snapshot from stuttgart.maps.luftdaten.info
How to build the air sensor
Building such a sensor is pretty easy and described on Luftdaten.info, the main page of the project. It consists of a handful of parts that are connected together.
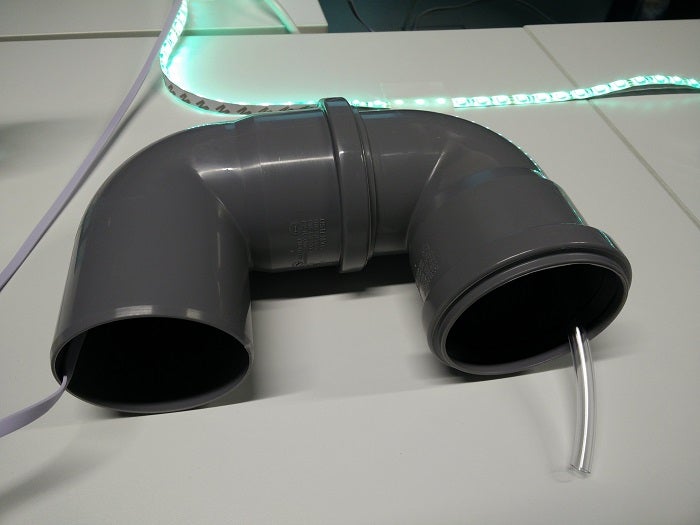
The casings are actually some standard plumbing tubes. The other two main components are a Node MCU ESP8266 microcontroller that has built-in Wi-Fi and the actual analyzer. In the current revision this is an SDS 011 analyzer. A DHT22 sensor provides readings of the current temperature and humidity. All parts cost together around €30.
Here in Stuttgart and other German cities, public assembly sessions are held where members of the Luftdaten project are available to help and who already flash the program on the sensor. Everyone who is interested can come to those sessions and assemble a sensor. The actual parts are paid for by donations and crowdfunding campaigns.

Assembly is pretty easy: Connect the dust sensor and the DHT with the NodeMCU with some cables, physically attach the NodeMCU and the dust sensor via a cable tie, and put the assembled sensor into the tubing.

Back home, the sensor is mounted outside and connected to power and Wi-Fi. Once this is done, the sensor location is reported to Luftdaten.info and they will put it on the map (the map location is not precise so as to not reveal the exact location to the public).
Sending the data
The sensor now runs every minute for 10 seconds where the fan pulls in air and the SDS 011 the counts the dust particles.
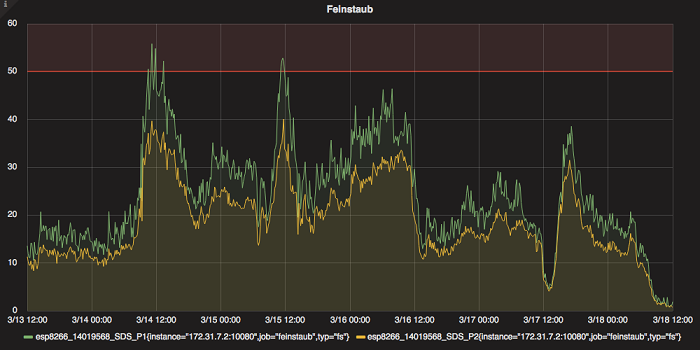
In addition to sending the sensor data to Luftdaten.info, sending the data to a local database is also possible. I have implemented a small gateway to store the data into a Prometheus database so I can graph historic values via Grafana.

As you can see on the graph, in the area where I live, there is two times the allowed maximum value of 50µg/m3.
Note: Air pollution is often an issue in winter when there is an inversion weather pattern where the cold air on the ground does not move and hot air on top sits on top of it like a cap, further preventing air circulation. An additional effect is that due to the cold, households heat more with fossil fuels, which emit more pollution.
The hobby sensors are not calibrated and less accurate than the official high-tech ones, but the trend is the same, and technicians from some environmental agencies have confirmed that those sensors are not far off from the much more expensive official analyzers.
What's next
Motor technology and filters have helped reduce the dust levels from car and industry exhausts, but those modern motors tend to emit more nitric oxide (NOx). Luftdaten.info has started a new crowdfunding campaign to buy NOx analyzers for displaying nitric oxide levels on the map.


1 Comment