Distributed tracing systems enable users to track a request through a software system that is distributed across multiple applications, services, and databases as well as intermediaries like proxies. This allows for a deeper understanding of what is happening within the software system. These systems produce graphical representations that show how much time the request took on each step and list each known step.
A user reviewing this content can determine where the system is experiencing latencies or blockages. Instead of testing the system like a binary search tree when requests start failing, operators and developers can see exactly where the issues begin. This can also reveal where performance changes might be occurring from deployment to deployment. It’s always better to catch regressions automatically by alerting to the anomalous behavior than to have your customers tell you.
How does this tracing thing work? Well, each request gets a special ID that’s usually injected into the headers. This ID uniquely identifies that transaction. This transaction is normally called a trace. The trace is the overall abstract idea of the entire transaction. Each trace is made up of spans. These spans are the actual work being performed, like a service call or a database request. Each span also has a unique ID. Spans can create subsequent spans called child spans, and child spans can have multiple parents.
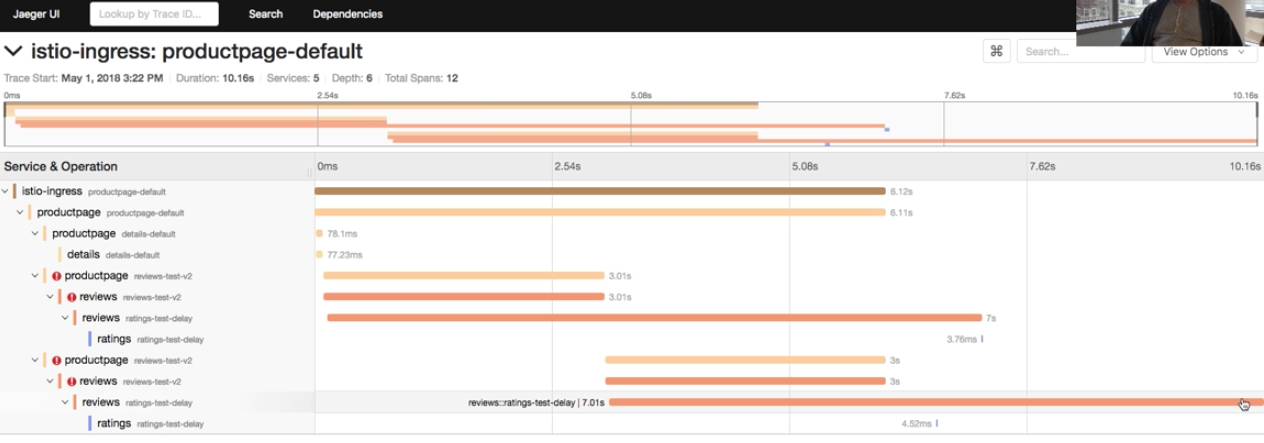
Once a transaction (or trace) has run its course, it can be searched in a presentation layer. There are several tools in this space that we’ll discuss later, but the picture below shows Jaeger from my Istio walkthrough. It shows multiple spans of a single trace. The power of this is immediately clear as you can better understand the transaction’s story at a glance.

This demo uses Istio’s built-in OpenTracing implementation, so I can get tracing without even modifying my application. It also uses Jaeger, which is OpenTracing-compatible.
So what is OpenTracing? Let’s find out.
OpenTracing API
OpenTracing is a spec that grew out of Zipkin to provide cross-platform compatibility. It offers a vendor-neutral API for adding tracing to applications and delivering that data into distributed tracing systems. A library written for the OpenTracing spec can be used with any system that is OpenTracing-compliant. Zipkin, Jaeger, and Appdash are examples of open source tools that have adopted the open standard, but even proprietary tools like Datadog and Instana are adopting it. This is expected to continue as OpenTracing reaches ubiquitous status.
OpenCensus
Okay, we have OpenTracing, but what is this OpenCensus thing that keeps popping up in my searches? Is it a competing standard, something completely different, or something complementary?
The answer depends on who you ask. I will do my best to explain the difference (as I understand it): OpenCensus takes a more holistic or all-inclusive approach. OpenTracing is focused on establishing an open API and spec and not on open implementations for each language and tracing system. OpenCensus provides not only the specification but also the language implementations and wire protocol. It also goes beyond tracing by including additional metrics that are normally outside the scope of distributed tracing systems.
OpenCensus allows viewing data on the host where the application is running, but it also has a pluggable exporter system for exporting data to central aggregators. The current exporters produced by the OpenCensus team include Zipkin, Prometheus, Jaeger, Stackdriver, Datadog, and SignalFx, but anyone can create an exporter.
From my perspective, there’s a lot of overlap. One isn’t necessarily better than the other, but it’s important to know what each does and doesn’t do. OpenTracing is primarily a spec, with others doing the implementation and opinionation. OpenCensus provides a holistic approach for the local component with more opinionation but still requires other systems for remote aggregation.
Tool options
Zipkin
Zipkin was one of the first systems of this kind. It was developed by Twitter based on the Google Dapper paper about the internal system Google uses. Zipkin was written using Java, and it can use Cassandra or ElasticSearch as a scalable backend. Most companies should be satisfied with one of those options. The lowest supported Java version is Java 6. It also uses the Thrift binary communication protocol, which is popular in the Twitter stack and is hosted as an Apache project.
The system consists of reporters (clients), collectors, a query service, and a web UI. Zipkin is meant to be safe in production by transmitting only a trace ID within the context of a transaction to inform receivers that a trace is in process. The data collected in each reporter is then transmitted asynchronously to the collectors. The collectors store these spans in the database, and the web UI presents this data to the end user in a consumable format. The delivery of data to the collectors can occur in three different methods: HTTP, Kafka, and Scribe.
The Zipkin community has also created Brave, a Java client implementation compatible with Zipkin. It has no dependencies, so it won’t drag your projects down or clutter them with libraries that are incompatible with your corporate standards. There are many other implementations, and Zipkin is compatible with the OpenTracing standard, so these implementations should also work with other distributed tracing systems. The popular Spring framework has a component called Spring Cloud Sleuth that is compatible with Zipkin.
Jaeger
Jaeger is a newer project from Uber Technologies that the CNCF has since adopted as an Incubating project. It is written in Golang, so you don’t have to worry about having dependencies installed on the host or any overhead of interpreters or language virtual machines. Similar to Zipkin, Jaeger also supports Cassandra and ElasticSearch as scalable storage backends. Jaeger is also fully compatible with the OpenTracing standard.
Jaeger’s architecture is similar to Zipkin, with clients (reporters), collectors, a query service, and a web UI, but it also has an agent on each host that locally aggregates the data. The agent receives data over a UDP connection, which it batches and sends to a collector. The collector receives that data in the form of the Thrift protocol and stores that data in Cassandra or ElasticSearch. The query service can access the data store directly and provide that information to the web UI.
By default, a user won’t get all the traces from the Jaeger clients. The system samples 0.1% (1 in 1,000) of traces that pass through each client. Keeping and transmitting all traces would be a bit overwhelming to most systems. However, this can be increased or decreased by configuring the agents, which the client consults with for its configuration. This sampling isn’t completely random, though, and it’s getting better. Jaeger uses probabilistic sampling, which tries to make an educated guess at whether a new trace should be sampled or not. Adaptive sampling is on its roadmap, which will improve the sampling algorithm by adding additional context for making decisions.
Appdash
Appdash is a distributed tracing system written in Golang, like Jaeger. It was created by Sourcegraph based on Google’s Dapper and Twitter’s Zipkin. Similar to Jaeger and Zipkin, Appdash supports the OpenTracing standard; this was a later addition and requires a component that is different from the default component. This adds risk and complexity.
At a high level, Appdash’s architecture consists mostly of three components: a client, a local collector, and a remote collector. There’s not a lot of documentation, so this description comes from testing the system and reviewing the code. The client in Appdash gets added to your code. Appdash provides Python, Golang, and Ruby implementations, but OpenTracing libraries can be used with Appdash’s OpenTracing implementation. The client collects the spans and sends them to the local collector. The local collector then sends the data to a centralized Appdash server running its own local collector, which is the remote collector for all other nodes in the system.


Comments are closed.