It's challenging to understand your Python project as it gets larger and more complex. Even when you write the entire project, it's impossible to know how it works fully. Debugging and profiling your code is essential to better understanding it.
VizTracer is a tool to help you understand Python code by tracing and visualizing its execution. Without making any changes to your source code, VizTracer can log function entries/exits, function arguments/returns, and any arbitrary variables, then display the data using an intuitive front-end Google Trace-Viewer.
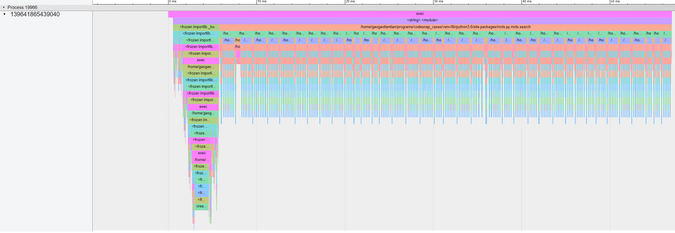
Here is an example of running a Monte Carlo tree search:

(Tian Gao, CC BY-SA 4.0)
Every function is logged and visualized in stack style on a timeline so that you can see what is happening when you run a program. You can zoom in to see the details at any specific point:

(Tian Gao, CC BY-SA 4.0)
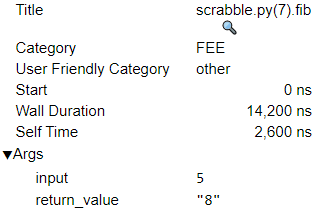
VizTracer can also automatically log function arguments and return value; you can click on the function entry and see the detail info:

(Tian Gao, CC BY-SA 4.0)
Or you can create a whole new signal and use it to log variables. For example, this shows the cost value when you do a gradient descent:

(Tian Gao, CC BY-SA 4.0)
In contrast to other tools with complicated setups, VizTracer is super-easy to use and does not have any dependencies. You can install it from pip with:
pip install viztracerAnd trace your program by entering (where <your_script.py> is the name of your script):
viztracer <your_script.py>VizTracer will generate an HTML report in your working directory that you can open in Chrome.
VizTracer offers other advanced features, such as filters, which you can use to filter out the functions that you do not want to trace so that you'll have a cleaner report. For example, to include only the functions in files, you are interested in:
viztracer include_files ./ --run <your_script.py>To record the function arguments and return value:
viztracer --log_function_args --log_return_value <your_script.py>To log any arbitrary variables matching a certain regex:
# log variables starts with a
viztracer --log_var a.* --run <your_script.py>
You can get other features, like custom events to log numeric values and objects, by making minor modifications to your source code.
VizTracer also includes a virtual debugger (vdb) that can debug VizTracer's log file. vdb debugs your executed code (much like pdb) so that you can understand the code flow. Helpfully, it supports running back in time because it knows everything that happened.
Unlike some prototypes, VizTracer implements its core in pure C, which significantly reduces the overhead to a level similar to cProfile.
VizTracer is open source, released under the Apache 2.0 License, and supports all common operating systems platforms (Linux, macOS, and Windows). You can learn more about its features and access its source code on GitHub.


1 Comment