As more workloads are migrated to containerized environments, it becomes challenging to manage those larger numbers of containers and the connections between them and other systems. As the scale and complexity of a containerized environment increase past a human's ability to manage, container orchestration platforms such as Kubernetes become increasingly important. Such platforms, however, come with their own management challenges that require metrics, observability, and a user-friendly interface to present their huge amount of complexity.
Enter Lens
Lens, which bills itself as "the Kubernetes IDE," is a useful, attractive, open source user interface (UI) for working with Kubernetes clusters. Out of the box, Lens can connect to Kubernetes clusters using your kubeconfig file and will display information about the cluster and the objects it contains. Lens can also connect to—or install—a Prometheus stack and use it to provide metrics about the cluster, including node information and health.

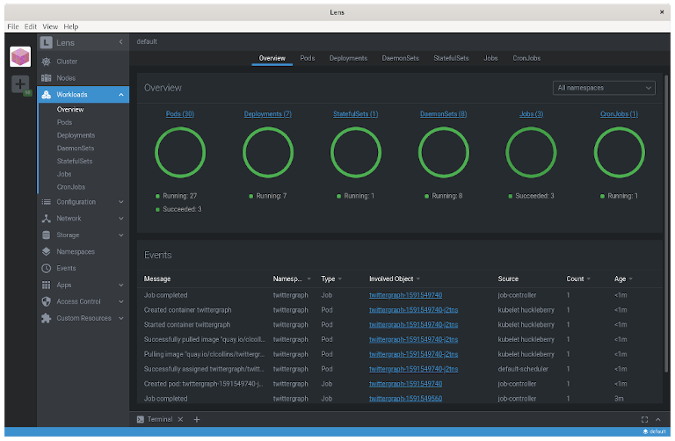
Lens, displaying an overview of cluster workloads. (Chris Collins, CC BY-SA 4.0)
Like Kubernetes' dashboard and OpenShift, Lens provides live updates on the state of objects in the cluster and metrics collected by Prometheus.
Get started
Installing Lens is straightforward. AppImage packages are available for Linux, and there are binaries available for macOS and Windows clients. This tutorial explains how to download and use the Lens AppImage to install and use Lens on Linux.
According to AppImage's FAQ, an AppImage is "a downloadable file for Linux that contains an application and everything the application needs to run." An application packaged as an AppImage is just that—a single executable file that can be downloaded and run.
The AppImage for Lens can be downloaded from the Lens Releases page on GitHub. After you download it, mark the file executable with chmod, and then either execute it directly or copy it to a place in your $PATH:
# Download the 3.4.0 AppImage for Lens, mark it executable and copy it to your $PATH
# (output omitted for brevity)

$ wget https://github.com/lensapp/lens/releases/download/v3.4.0/Lens-3.4.0.AppImage
$ chmod +x Lens-3.4.0.AppImage
$ sudo mv Lens-3.4.0.AppImage /usr/sbin/lens
Then you can start Lens by typing lens on the command line.
Connect Lens to a Kubernetes cluster
Once you launch Lens, connect it to a Kubernetes cluster by clicking the + icon in the top-left corner and selecting a kubeconfig. Next, a drop-down box will appear containing any Kubernetes contexts from your ~/.kube/config file, or you can select a custom one. Because cluster and authentication information about the cluster for any context is included in the kubeconfig file, Lens treats each context as a different cluster, unfortunately.
This is particularly unhelpful compared with how OpenShift creates context information in the kubeconfig file automatically for any project (namespace) you switch to. As a site-reliability engineer (SRE) working on hundreds of clusters, I had dozens and dozens of "clusters" to choose from when setting up Lens. In practice, I found it best to select the default context for any cluster. You can manage all namespaces and workloads once Lens has connected, and there's no need to add them all.
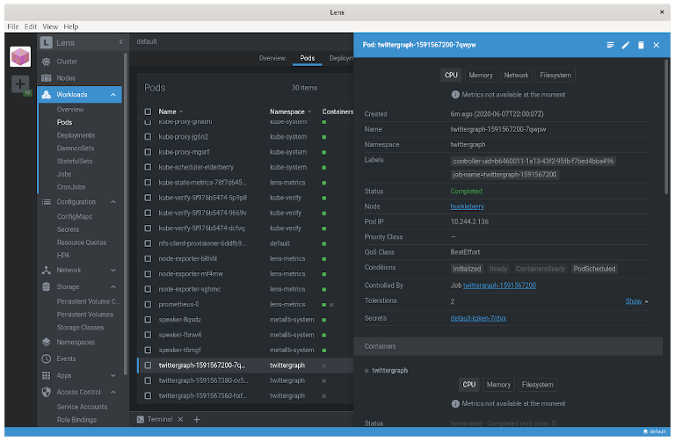
Once it's connected, Lens will display a ton of information about your cluster. You can see the workloads that are running: pods and deployments, daemon sets, cron jobs, etc. You can also view information about config maps and secrets, networking information, storage, namespaces, and events. Each will let you drill down into the information about a given object, and you can even edit the objects directly in Lens.

An overview of cluster workloads in Lens. (Chris Collins, CC BY-SA 4.0)
. (Chris Collins, CC BY-SA 4.0)
Gather metrics about your cluster
One of Lens' incredibly helpful features is its ability to connect to a Prometheus stack installed in your cluster to gather metrics about the cluster and its nodes for both current and historical data. This is great for getting at-a-glance information about the cluster right within the Lens UI without having to go to an external dashboard. However, the information presented is not comprehensive–it's good for an overview, but you may still wish to utilize a visualization tool such as Grafana with a more complicated dashboard to gather more specialized information.
Along with being able to connect to an existing Prometheus stack provisioned in the cluster, Lens can install applications on your behalf, too. This is very useful for enthusiasts running Kubernetes clusters in their homelabs to be able to deploy and connect to Prometheus in a single click.
Install Prometheus with Lens
If you have been following along with this series, especially Build a Kubernetes cluster with the Raspberry Pi, you will have a Kubernetes cluster provisioned in your homelab for education and tinkering. One thing the vanilla cluster lacks is metrics, and this is a great opportunity to add Prometheus to the cluster and install the kube-state-metrics service to gather information about the cluster.
To install it, just right-click on the cluster icon in the top-left corner of the Lens UI (after connecting to the cluster, of course) and select Settings. Under Features on the Settings page, you will find a Metrics section and a button to install Prometheus. Click Install to deploy the Prometheus stack to your cluster, and Lens will auto-detect its existence and begin displaying metrics. (It will take a minute—the new Prometheus has to collect some metrics first.)
I also appreciate that Lens links directly to the manifests used to deploy this stack, so you can verify what will be created before doing it, if you want.

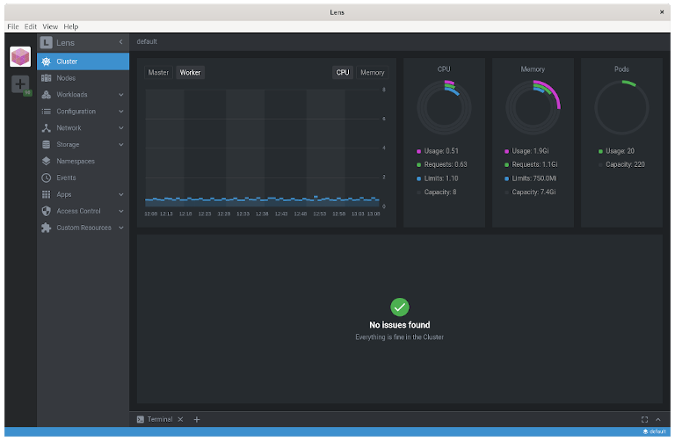
Lens UI displaying hardware utilization metrics about the cluster. (Chris Collins, CC BY-SA 4.0)
Fix kube-state-metrics
Unfortunately, while Prometheus will install just fine on a Raspberry Pi-based cluster, the kube-state-metrics service will fail. Currently, the kube-state-metrics project does not build an AArch64/ARM64 image, so pods created from that image will continuously crash with exec format error messages in the logs.
Luckily this issue is being tracked, and the kube-state-metrics project is working toward building the infrastructure to produce official ARM images. Until then, however, you can use a community-developed image and patch the kube-state-metrics deployment directly using Lens.
Go back into the cluster information, click on Workloads, and select Deployments. A list of all the Kubernetes deployment objects in the cluster will appear in the pane on the right. You should be able to pick out the kube-state-metrics deployment easily by the angry red entry under the Conditions column that indicates the crash-looping pod issue.
Select the kube-state-metrics deployment, and details of the object slide out from the right in an overlay window. In the upper-right corner of this window is a pencil icon. Click that icon to open an editor window with the YAML representation of the kube-state-metrics deployment. Scroll down, and edit the .spec.template.spec.containers.image value. By default, this value points to the official image: quay.io/coreos/kube-state-metrics:v1.9.5. Replace this value with docker.io/carlosedp/kube-state-metrics:v1.9.5.
In that same deployment are nodeAffinity rules, one of which forces the deployment to only run pods on hosts with amd64 architecture. This won't work for an AArch64/ARM64 Raspberry Pi, and with the updated image above, it's not useful. Find the key beta.kubernetes.io/arch in .spec.template.spec.affinity.nodeAffinity.requiredDuringSchedulingIgnoredDuringExecution.nodeSelectorTerms:
    - key: beta.kubernetes.io/arch
     operator: In
     values:
      - amd64
Delete this key entirely, and that will allow the pods from the deployment to be scheduled on your Raspbery Pi nodes. Click Save. This will trigger the deployment to roll out new kube-state-metrics pods with an ARM64 architecture, and they should become ready and begin reporting the metrics directly to Prometheus.
Lens lets you see clearly
Kubernetes is complex, and any tool that makes it easier to visualize and work with Kubernetes clusters can lower the barrier of entry for new folks and make life considerably easier for experienced Kubernetes administrators. Lens knocks this out of the park with an attractive, intuitive, and easy-to-use UI for managing one or more clusters, from the 10,000-foot view down into the nitty-gritty of individual Kubernetes objects. Lens also helps display metrics about the cluster and makes installing and using a Prometheus stack to display the metrics almost push-button.
I am extremely impressed with Lens and use it to manage several Kubernetes clusters in my own homelab, and I hope you find it useful as well. Do you have tools you like for managing or visualizing what goes on in your Kubernetes clusters? Share them in the comments, so we can all try them out!


Comments are closed.