

The Java Development Kit (JDK) provides binaries, tools, and compilers for the development of Java applications. One helpful tool included is jconsole.
To demonstrate, I will use the WildFly J2EE application server, which is part of the JBOSS open source application server project. First, I start up a standalone instance.
~/wildfly/24.0.1/bin$ ./standalone.sh
=========================================================================

  JBoss Bootstrap Environment

  JBOSS_HOME: /home/alan/wildfly/24.0.1

  JAVA: /usr/lib/jvm/java-11-openjdk-11.0.11.0.9-5.fc34.x86_64/bin/java
Now, in another terminal, I type jconsole.
$ jconsole
Upon launching, jconsole lists local instances. Select Local Process, then select the name of the process and click Connect. That is all it takes to connect and begin using jconsole with a running Java Virtual Machine (JVM).

(Alan Formy-Duvall, CC BY-SA 4.0)
Overview
The Java Monitoring and Management Console shows the process identifier (PID) at the top of the dashboard. The Overview tab has four graphs to show the vitals for Heap Memory Usage, Threads, Classes, and CPU Usage.

(Alan Formy-Duvall, CC BY-SA 4.0)
The tabs along the top provide more detailed views of each area.
Memory
The Memory tab displays graphs of various aspects of the memory being used by the JVM. The amount of the server system memory allocated to the JVM is called the heap. This screen also provides details about usage by the internal components of the heap, such as the Eden Space, Old Gen, and the Survivor Space. You can manually request a garbage collection action as well.
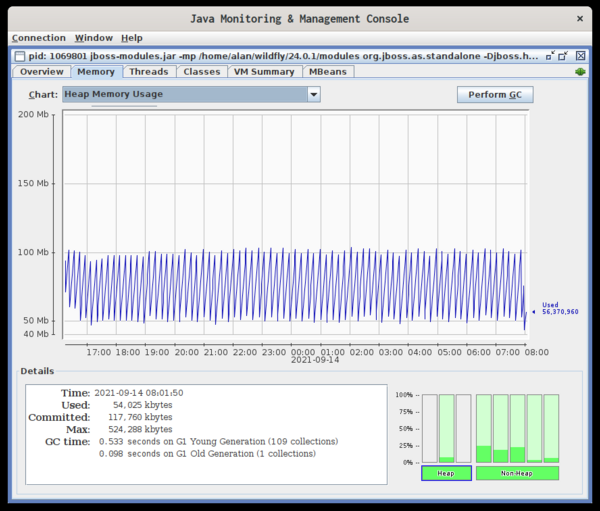
(Alan Formy-Duvall, CC BY-SA 4.0)
Threads
The Threads tab shows how many threads are running. You can also manually check for deadlocks.

(Alan Formy-Duvall, CC BY-SA 4.0)
Classes
The classes tab tells you how many classes are loaded and how many have been unloaded.

(Alan Formy-Duvall, CC BY-SA 4.0)
VM Summary
The VM Summary tab provides many details about the application and the host system. You can learn which operating system and architecture you are on, the total amount of system memory, the number of CPUs, and even swap space.

(Alan Formy-Duvall, CC BY-SA 4.0)
Further details about the JVM shown in the summary include current and maximum heap size and information about the garbage collectors in use. The bottom pane lists all of the arguments passed to the JVM.
MBeans
The last tab, MBeans, lets you drill down through all of the MBeans to view attributes and values for each.

(Alan Formy-Duvall, CC BY-SA 4.0)
Conclusion
Java has been around a long time, and it continues to power millions of systems worldwide. Plenty of development environments and monitoring systems are available, but having a tool like jconsole included in the base kit can be highly valuable.


Comments are closed.