SigNoz is an open source application observability platform. Built in React and Go, SigNoz is written from the ground up to allow developers to get started with their observability goals as soon as possible and with minimum effort.
This article looks at the software in detail, including the architecture, Kubernetes-based deployment, and some common SigNoz uses.
SigNoz architecture
SigNoz ties several components together to create a scalable, loosely coupled system that is easy to get started with. Some of the most important components are:
- OpenTelemetry Collector
- Apache Kafka
- Apache Druid
OpenTelemetry Collector is the trace or metrics data collection engine. This enables SigNoz to ingest data in industry-standard formats, including Jaeger, Zipkin, and OpenConsensus. Then the collected data is forwarded to Apache Kafka.
SigNoz uses Kafka and stream processors for real-time ingestion of high volumes of observability data. This data is then passed on to Apache Druid, which excels at storing such data for short- and long-term SQL analysis.
Once the data is flattened and stored in Druid, SigNoz's query service can query and pass the data to the SigNoz React frontend. The front end then creates nice graphs for users to visualize the observability data.
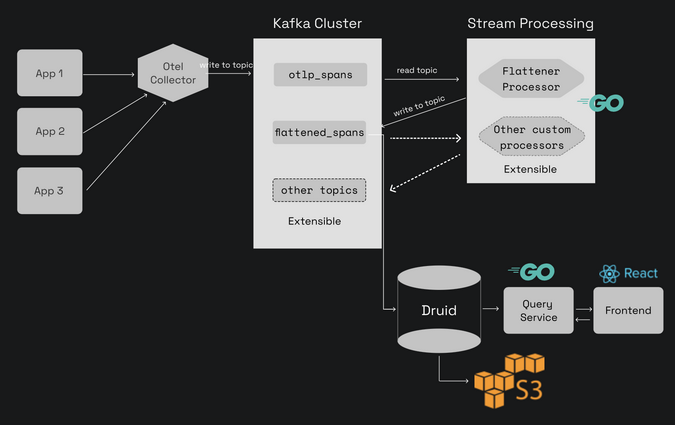
(Nitish Tiwari, CC BY-SA 4.0)
Install SigNoz
SigNoz's components include Apache Kafka and Druid. These components are loosely coupled and work in tandem to ensure a seamless experience for the end user. Given all the components, it is best to run SigNoz as a combination of microservices on Kubernetes or Docker Compose (for local testing).
This example uses a Kubernetes Helm chart-based deployment to install SigNoz on Kubernetes. As a prerequisite, you'll need a Kubernetes cluster. If you don't have a Kubernetes cluster available, you can use tools like MiniKube or Kind to create a test cluster on your local machine. Note that the machine should have at least 4GB available for this to work.
Once you have the cluster available and kubectl configured to communicate with the cluster, run:
$ git clone https://github.com/SigNoz/signoz.git && cd signoz

$ helm dependency update deploy/kubernetes/platform

$ kubectl create ns platform

$ helm -n platform install signoz deploy/kubernetes/platform

$ kubectl -n platform apply -Rf deploy/kubernetes/jobs

$ kubectl -n platform apply -f deploy/kubernetes/otel-collector
This installs SigNoz and related containers on the cluster. To access the user interface (UI), run the kubectl port-forward command; for example:
$ kubectl -n platform port-forward svc/signoz-frontend 3000:3000You should now be able to access your SigNoz dashboard using a local browser on the address https://localhost:3000.
Now that your observability platform is up, you need an application that generates observability data to visualize and trace. For this example, you can use HotROD, a sample application developed by the Jaegar team.
To install it, run:
$ kubectl create ns sample-application

$ kubectl -n sample-application apply -Rf sample-apps/hotrod/
Explore the features
You should now have a sample application with proper instrumentation up and running in the demo setup. Look at the SigNoz dashboard for metrics and trace data. As you land on the dashboard's home, you will see a list of all the configured applications that are sending instrumentation data to SigNoz.

(Nitish Tiwari, CC BY-SA 4.0)
Metrics
When you click on a specific application, you will land on the application's homepage. The Metrics page displays the last 15 minutes worth (this number is configurable) of information, like application latency, average throughput, error rate, and the top endpoints the application is accessing. This gives you a birds-eye view of the application's status. Any spikes in errors, latency, or load are immediately visible.
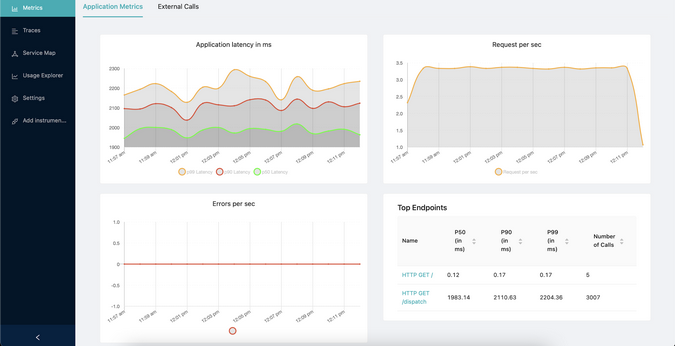
(Nitish Tiwari, CC BY-SA 4.0)
Tracing
The Traces page lists every request in chronological order with high-level details. As soon as you identify a single request of interest (e.g., something taking longer than expected to complete), you can click the trace and look at individual spans for every action that happened inside that request. The drill-down mode offers thorough inspection for each request.
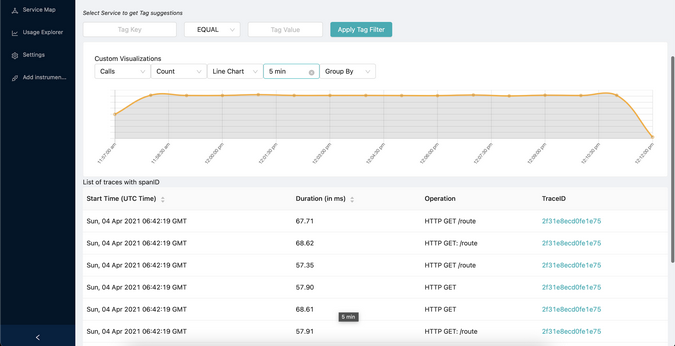
(Nitish Tiwari, CC BY-SA 4.0)

(Nitish Tiwari, CC BY-SA 4.0)
Usage Explorer
Most of the metrics and tracing data are very useful, but only for a certain period. As time passes, the data ceases to be useful in most cases. This means it is important to plan a proper retention duration for data; otherwise, you will pay more for the storage. The Usage Explorer provides an overview of ingested data per hour, day, and week.
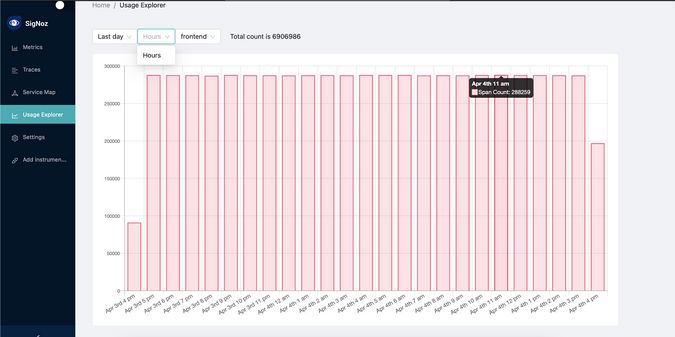
(Nitish Tiwari, CC BY-SA 4.0)
Add instrumentation
So far, you've been looking at metrics and traces from the sample HotROD application. Ideally, you'll want to instrument your application so that it sends observability data to SigNoz. Do this by following the Instrumentation Overview on SigNoz's website.
SigNoz supports a vendor-agnostic instrumentation library, OpenTelemetry, as the primary way to configure instrumentation. OpenTelemetry offers instrumentation libraries for various languages with support for both automatic and manual instrumentation.
Learn more
SigNoz helps developers get started quickly with metrics and tracing applications. To learn more, you can consult the documentation, join the community, and access the source code on GitHub.





Comments are closed.