

Gathering data as it changes over the passage of time is known as time-series data. Today, it has become a part of every industry and ecosystem. It is a large part of the growing IoT sector and will become a larger part of everyday people's lives. But time-series data and its requirements are hard to work with. This is because there are no tools that are purpose-built to work with time-series data. In this article, I go into detail about those problems and how InfluxData has been working to solve them for the past 10 years.
InfluxData
InfluxData is an open source time-series database platform. You may know about the company through InfluxDB, but you may not have known that it specialized in time-series databases. This is significant, because when managing time-series data, you deal with two issues — storage lifecycle and queries.
When it comes to storage lifecycle, it's common for developers to initially collect and analyze highly detailed data. But developers want to store smaller, downsampled datasets that describe trends without taking up as much storage space.
When querying a database, you don't want to query your data based on IDs. You want to query based on time ranges. One of the most common things to do with time-series data is to summarize it over a large period of time. This kind of query is slow when storing data in a typical relational database that uses rows and columns to describe the relationships of different data points. A database designed to process time-series data can handle queries exponentially faster. InfluxDB has its own built-in querying language: Flux. This is specifically built to query on time-series data sets.
(Zoe Steinkamp, CC BY-SA 4.0)
Data acquisition
Data acquisition and data manipulation come out of the box with some awesome tools. InfluxData has over 12 client libraries that allow you to write and query data in the coding language of your choice. This is a great tool for custom use cases. The open source ingest agent, Telegraf, includes over 300 input and output plugins. If you're a developer, you can contribute your own plugin, as well.
InfluxDB can also accept a CSV upload for small historical data sets, as well as batch imports for large data sets.
import math
bicycles3 = from(bucket: "smartcity")
    |> range(start:2021-03-01T00:00:00z, stop: 2021-04-01T00:00:00z)
    |> filter(fn: (r) => r._measurement == "city_IoT")
    |> filter(fn: (r) => r._field == "counter")
    |> filter(fn: (r) => r.source == "bicycle")
    |> filter(fn: (r) => r.neighborhood_id == "3")
    |> aggregateWindow(every: 1h, fn: mean, createEmpty:false)

bicycles4 = from(bucket: "smartcity")
    |> range(start:2021-03-01T00:00:00z, stop: 2021-04-01T00:00:00z)
    |> filter(fn: (r) => r._measurement == "city_IoT")
    |> filter(fn: (r) => r._field == "counter")
    |> filter(fn: (r) => r.source == "bicycle")
    |> filter(fn: (r) => r.neighborhood_id == "4")
    |> aggregateWindow(every: 1h, fn: mean, createEmpty:false)

join(tables: {neighborhood_3: bicycles3, neighborhood_4: bicycles4}, on ["_time"], method: "inner")
    |> keep(columns: ["_time", "_value_neighborhood_3","_value_neighborhood_4"])
    |> map(fn: (r) => ({
        r with
        difference_value : math.abs(x: (r._value_neighborhood_3 - r._value_neighborhood_4))
    }))
Flux
Flux is our internal querying language built from the ground up to handle time-series data. It's also the underlying powerhouse for a few of our tools, including tasks, alerts, and notifications. To dissect the flux query from above, you need to define a few things. For starters, a "bucket" is what we call a database. You configure your buckets and then add your data stream into them. The query calls the smartcity bucket, with the range of a specific day (a 24-hour period to be exact.) You can get all the data from the bucket, but most users include a data range. That's the most basic flux query you can do.
Next, I add filters, which filter the data down to something more exact and manageable. For example, I filter for the count of bicycles in the neighborhood assigned to the id of 3. From there, I use aggregateWindow to get the mean for every hour. That means I expect to receive a table with 24 columns, one for every hour in the range. I do this exact same query for neighborhood 4 as well. Finally, I join the two tables and get the differences between bike usage in these two neighborhoods.
This is great if you want to know what hours are high-traffic hours. Obviously, this is just a small example of the power of flux queries. But it gives a great example of some of the tools flux comes with. I also have a large amount of data analysis and statistics functions. But for that, I suggest checking out the Flux documentation.
import "influxdata/influxdb/tasks"

option task = {name: PB_downsample, every: 1h, offset: 10s}
from(bucket: "plantbuddy")
    |>range(start: tasks.lastSuccess(orTime: -task.every))
    |>filter(fn: (r) => r["_measurement"] == "sensor_data")
    |>aggregateWindow(every: 10m, fn:last, createEmpty:false)
    |>yield(name: "last")
    |>to(bucket: "downsampled")
Tasks
An InfluxDB task is a scheduled Flux script that takes a stream of input data and modifies or analyzes it in some way. It then stores the modified data in a new bucket or performs other actions. Storing a smaller data set into a new bucket is called "downsampling," and it's a core feature of the database, and a core part of the time-series data lifecycle.
You can see in the current task example that I've downsampled the data. I'm getting the last value for every 10-minute increment and storing that value in the downsampled bucket. The original data set might have had thousands of data points in those 10 minutes, but now the downsampled bucket only has 60 new values. One thing to note is that I'm also using the last success function in range. This tells InfluxDB to run this task from the last time it ran successfully, just in case it has failed for the past 2 hours, in which case it can go back three hours in time to the last successful run. This is great for built-in error handling.
(Zoe Steinkamp, CC BY-SA 4.0)
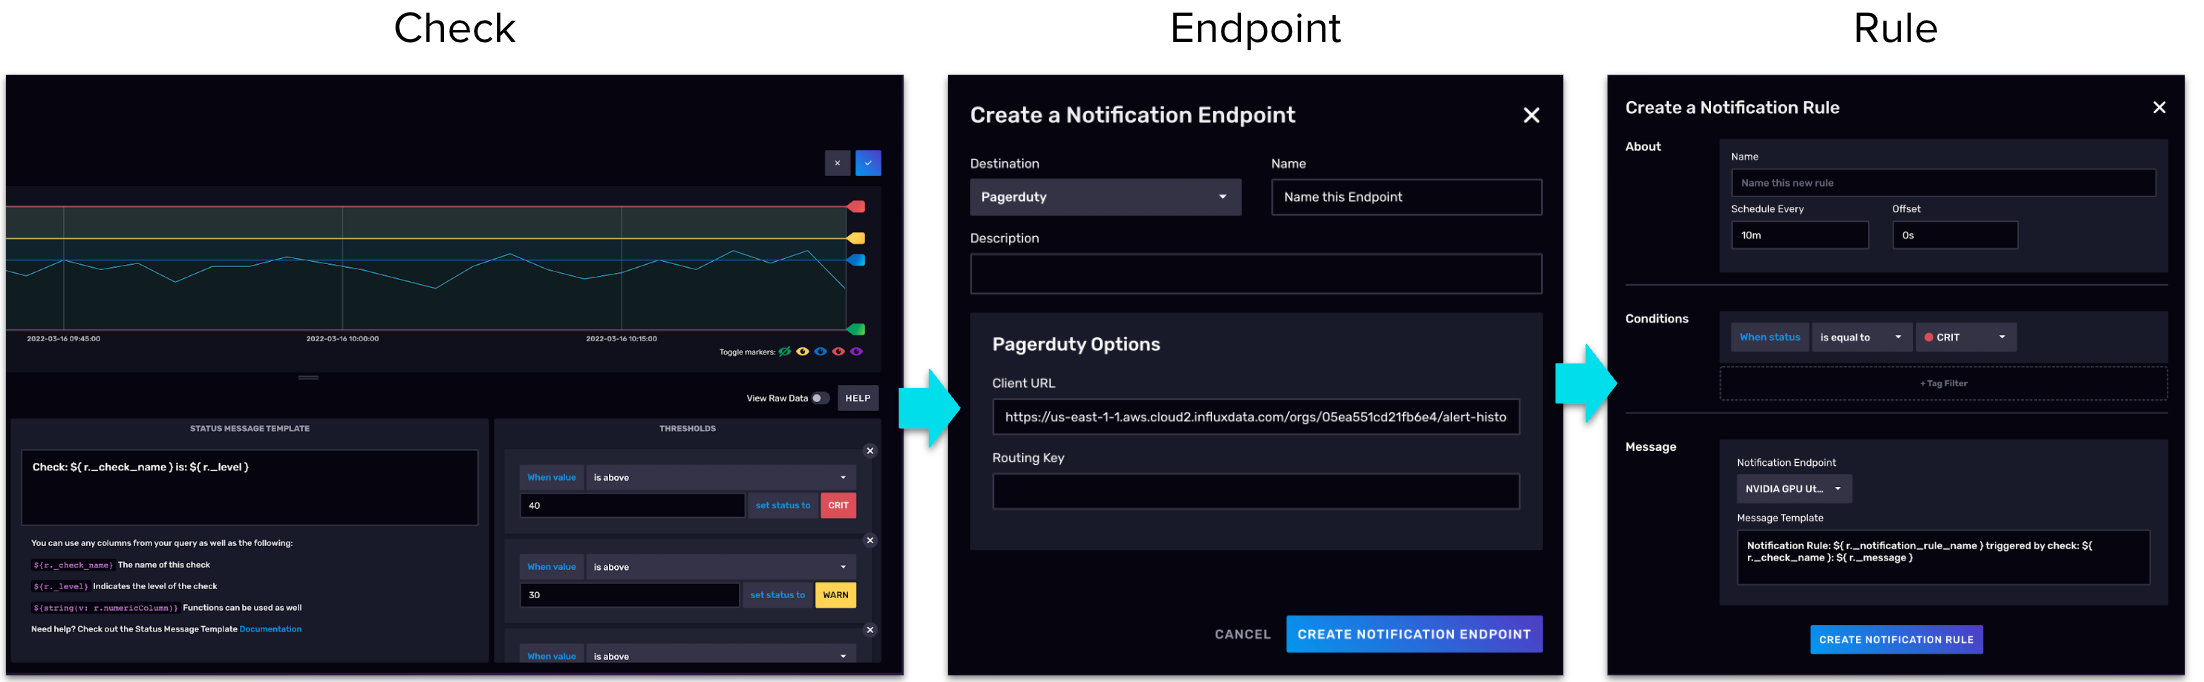
Checks and alerts
InfluxDB includes an alerting or checks and notification system. This system is very straightforward. You start with a check that looks at the data periodically for anomalies that you've defined. Normally, this is defined with thresholds. For example, any temperature value under 32° F gets assigned a value of WARN, and anything above 32° F gets assigned a value of OK, and anything below 0° F gets a value of CRITICAL. From there, your check can run as often as you deem necessary. There is a recorded history of your checks and the current status of each. You are not required to set up a notification when it's not needed. You can just reference your alert history as needed.
Many people choose to set up their notifications. For that, you need to define a notification endpoint. For example, a chat application could make an HTTP call to receive your notifications. Then you define when you would like to receive notifications, for example you can have checks run every hour. You can run notifications every 24 hours. You can have your notification respond to a change in the value, for example WARN to CRITICAL, or when a value is CRITICAL, regardless of it changing from OK to WARN. This is a highly customizable system. The Flux code that's created from this system can also be edited.
(Zoe Steinkamp, CC BY-SA 4.0)
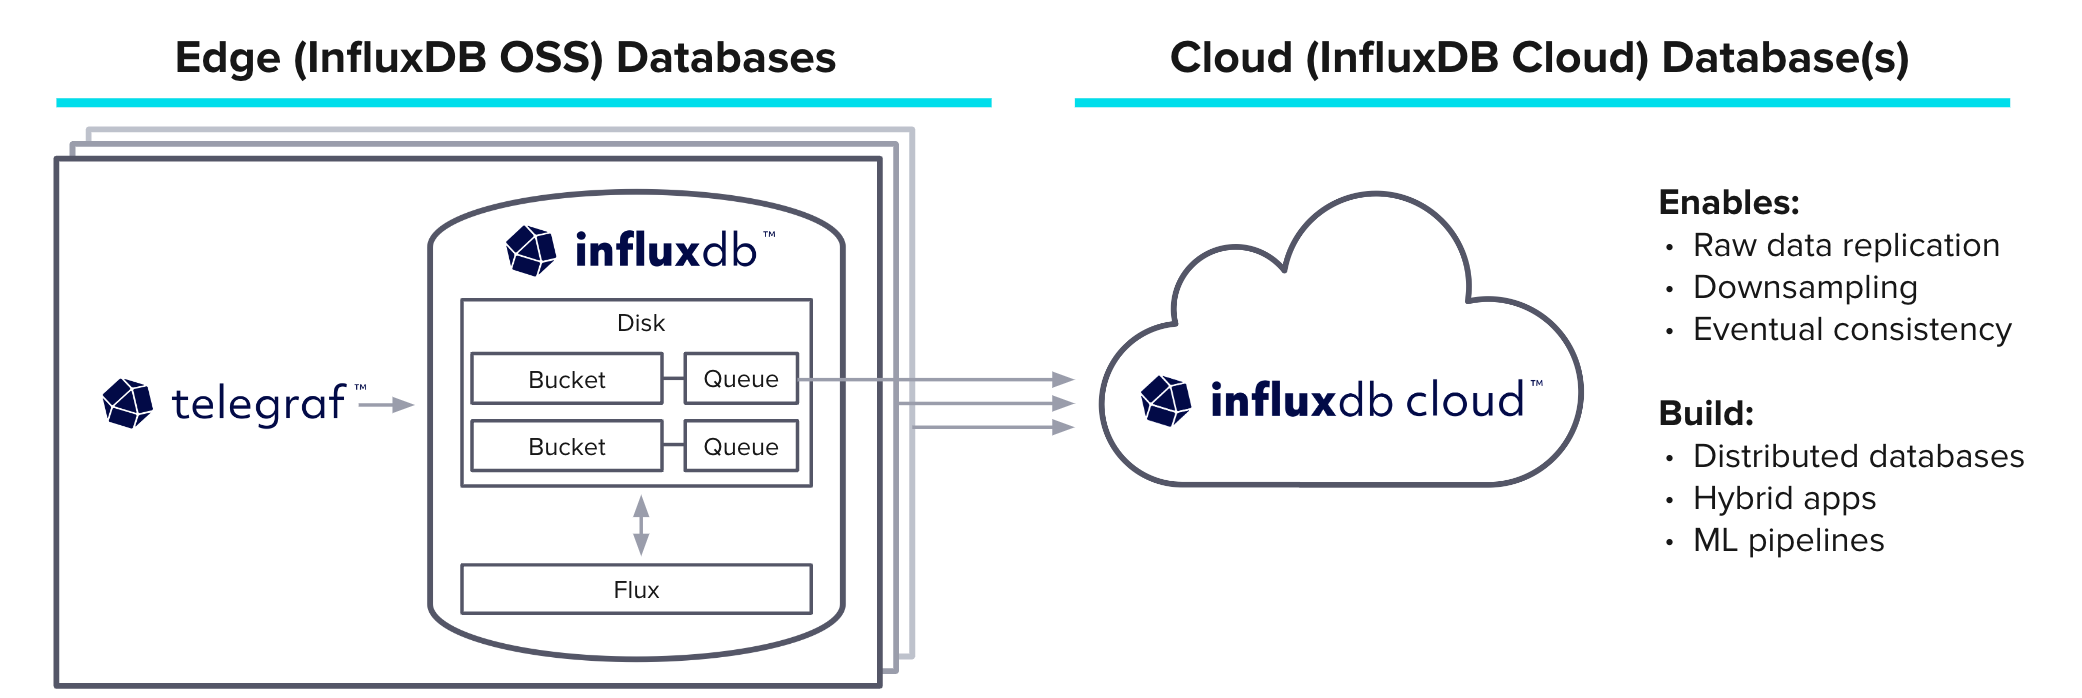
Edge
To wrap up, I'd like to bring all the core features together, including a very special new feature that's recently been released. Edge to cloud is a very powerful tool that allows you to run the open source InfluxDB and locally store your data in case of connectivity issues. When connectivity is repaired, it streams the data to the InfluxData cloud platform.
This is significant for edge devices and important data where any loss of data is detrimental. You define that you want a bucket to be replicated to the cloud, and then that bucket has a disk-backed queue to store the data locally. Then you define what your cloud bucket should replicate into. The data is stored locally until connected to the cloud.
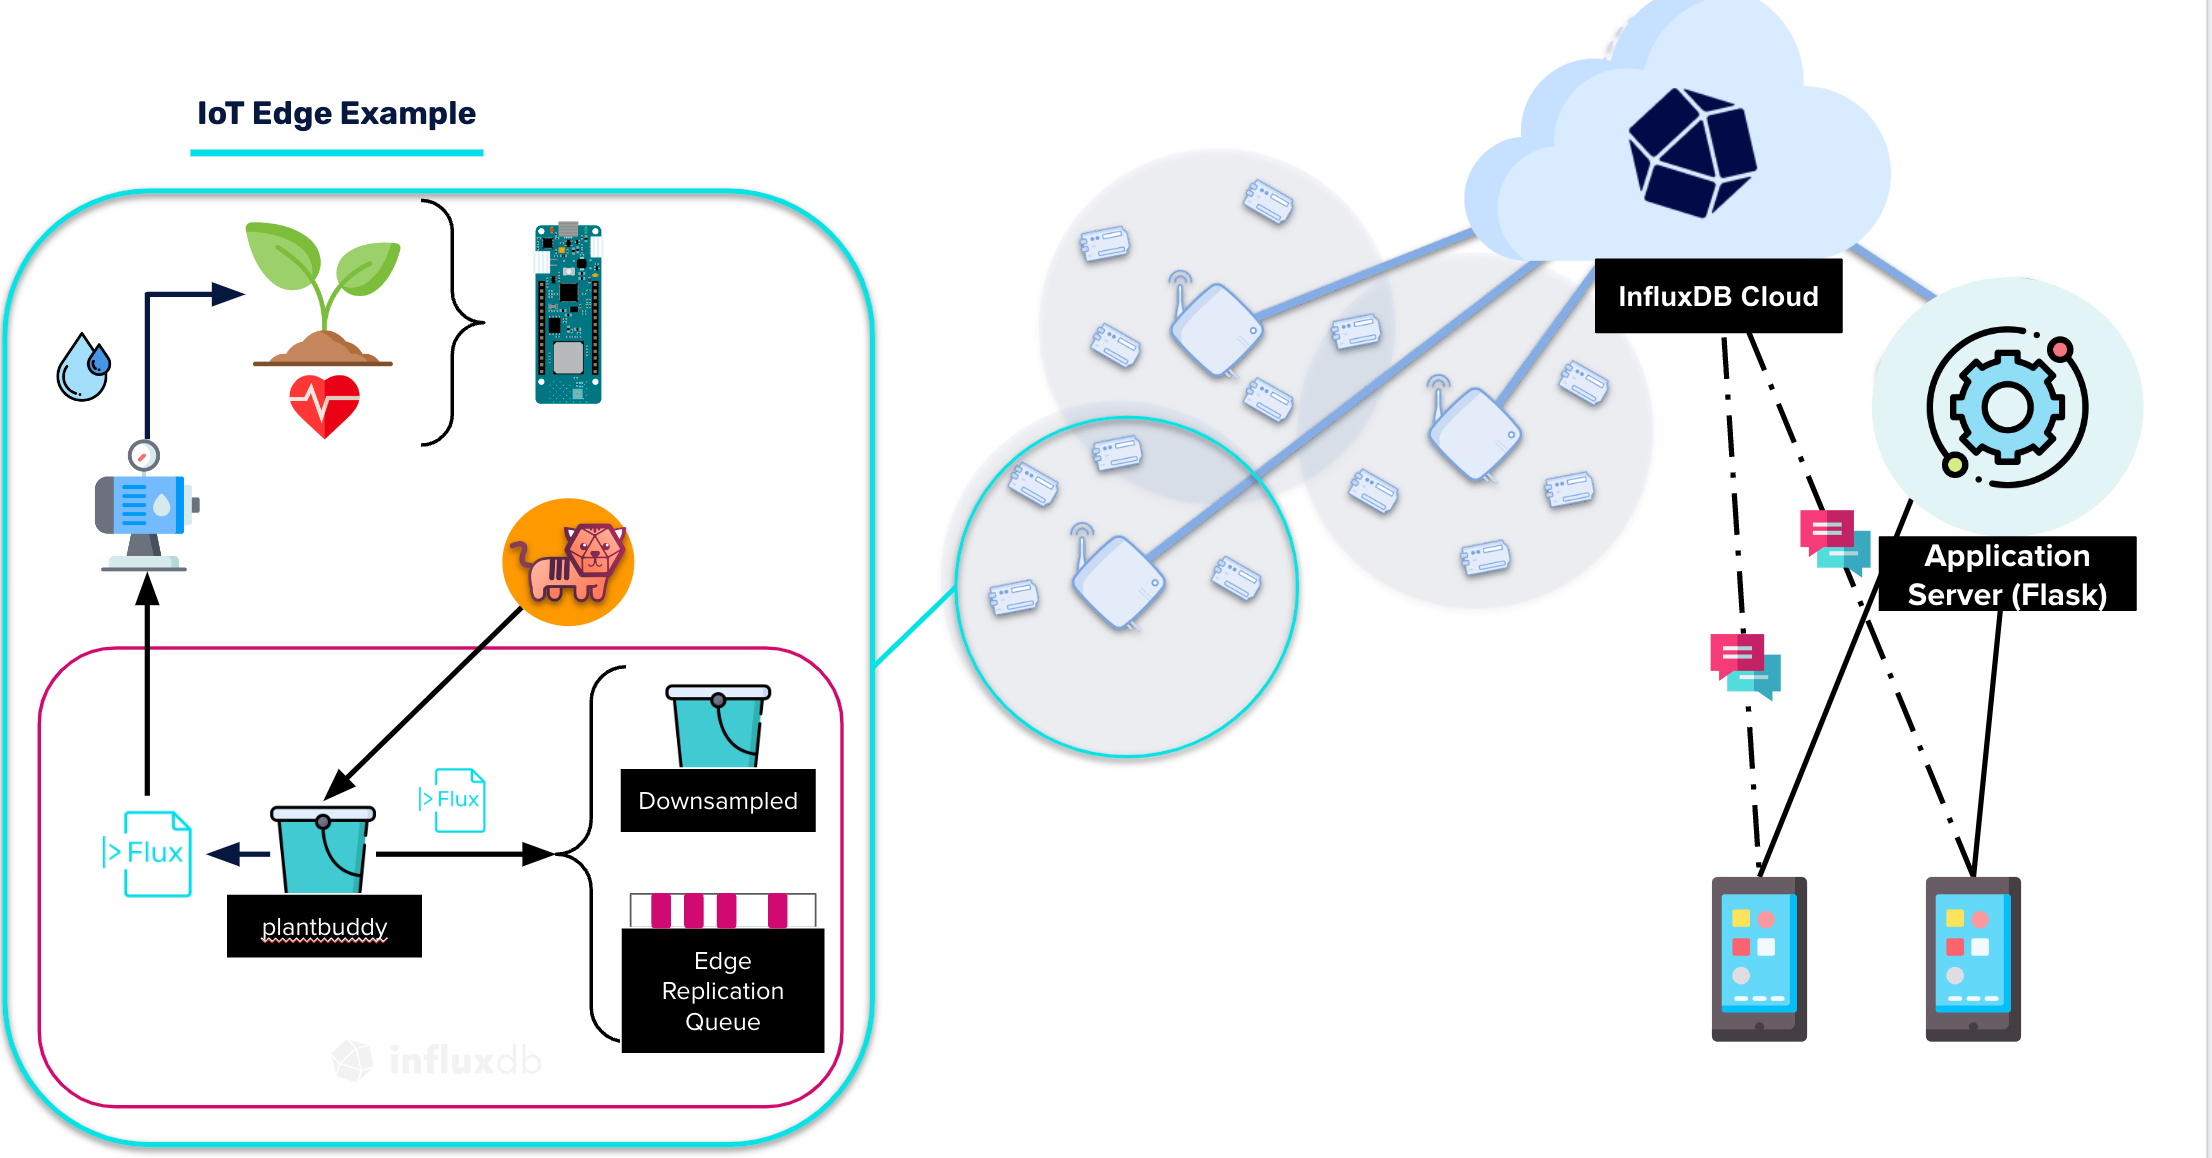
InfluxDB and the IoT Edge
Suppose you have a project where you want to monitor the health of household plants using IoT sensors attached to the plant. The project is set up using your laptop as the edge device. When your laptop is closed or otherwise off, it stores the data locally, and then streams it to my cloud bucket when reconnected.
(Zoe Steinkamp, CC BY-SA 4.0)
One thing to notice is that this downsamples data on the local device before storing it in the replication bucket. Your plant's sensors provide a data point for every second. But it condenses the data to be an average of one minute so you have less data to store. In the cloud account, you might add some alerts and notifications that let you know when the plant's moisture is below a certain level and needs to be watered. There could also be visuals you could use on a website to tell users about their plants' health.
Databases are the backbone of many applications. Working with time-stamped data in a time series database platform like InfluxDB saves developers time, and gives them access to a wide range of tools and services. The maintainers of InfluxDB love seeing what people are building within our open source community, so connect with us and share your projects and code with others!


1 Comment