Working directly with hardware is hard. Each project brings with it mundane questions of which compiler to use, what communications protocols to work with, and how to load code. Developers also need to figure out how to debug the live system without affecting the program being executed.
In the past this has required expensive and proprietary software, but thanks to commodity hardware and projects such as OpenOCD, developing programs that run directly on embedded hardware is easier than ever before.
When working with very small systems, nice features that programmers have come to rely on may not be available. In such a system, when something goes wrong the system can end up in an unknown state where the only fix is to reset the hardware. Doing so gets the system working again but will throw out any information that could lead to the diagnosis of the problem. Hardware debuggers provide insight into what a CPU is doing even if it appears frozen.
In contrast to software debuggers such as gdb (which either utilize operating system hooks or patch the running program to replace valid code with special instructions that cause the operating system to notify the debugger of an event), hardware debuggers take advantage of special pins on the chip that talk directly to the core. By using a specially-crafted connection, hardware debuggers give developers the same tools they usually rely on when developing under an operating system. A good hardware debugger environment allows a developer to break into and inspect the current program state, view (and sometimes change) variables, set watchpoints or breakpoints, and generally get a deeper understanding of a live system.
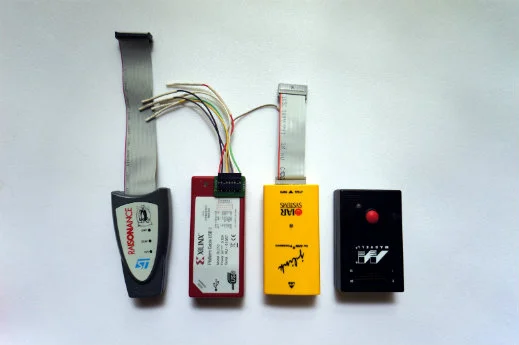
High-end chip manufacturers usually have a recommended development environment that will include an operating system, a compiler toolchain, and a specific debugger box. Sometimes this will be an in-house solution, and frequently such tools are very expensive and very cumbersome to use. Each chip vendor has their own environment, which has the tendency to fill shelves with exotic debug hardware. Access to documentation and hardware/software tools is frequently gated by non-disclosure agreements and expensive contracts, which means that only large companies can reap the benefits of live debugging.

Photo by Sean Cross, CC BY-SA 2.0
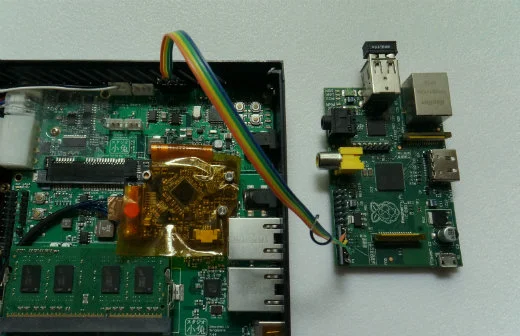
OpenOCD is an open source On-Chip Debugger. There are only a handful of common debug protocols, and by far the most common is JTAG. OpenOCD speaks JTAG, and can take advantage of a wide range of common JTAG boxes to allow for debugging a wide variety of hardware. OpenOCD has its own TCL-based scripting language and its own shell, but it also provides a gdbserver connection allowing for anything that speaks gdb to talk to real hardware. This means that it's possible to debug software using anything from gdb itself, all the way up to DDD, Eclipse, and IDA Pro. JTAG requires four wires, but some newer ARM chips use a two-wire variant. The protocol is the same, and some chips speak both. If a board has standard .1" headers and runs at 3.3V, it may be possible to simply use flywires without soldering anything at all.

Photo by Sean Cross, CC BY-SA 2.0
If you have a Raspberry Pi, you have the makings of a network-attached JTAG box. Raspbian has a recent version openocd available, so it's just an "apt-get install openocd" away. The package supports a variety of hardware, including generic FTDI cables, the Buspirate, generic GPIO, and the platform-specific Raspberry Pi GPIO header. Wiring things up is mostly a matter of connecting wires between the device under investigation and the hardware doing the investigating, such as the GPIO header.
Once everything is wired up and configured, OpenOCD gives powerful insight into what exactly the hardware is doing. The program offers a "telnet" server on port 4444, through which everything can be controlled. The device being investigated can be halted, and any area of memory can be read or modified. Hardware peripherals are frequently memory-mapped, which means it's possible to talk directly to the hardware by poking values into memory. For supported chips, OpenOCD takes advantage of this to enable reflashing chips by either poking programs into memory and then running them (e.g. on the Kinetis series of chips) or by manipulating the flash registers directly (e.g. on the STM32 family.)
When developing code for embedded platforms such as an STM32, OpenOCD comes in even more handy with its gdb integration. In addition to the telnet server on port 4444, a gdbserver-compatible port is opened on port 3333, allowing gdb to communicate with the hardware. If gdb is provided with a common embedded ELF file, it can create breakpoints on functions, step line-by-line, and catch certain types of signals thrown by the target hardware. By using the standard "load" command, gdb is able to reflash the board as well, which can speed up code/compile/test cycles.
If properly configured, OpenOCD can even provide some measure of RTOS integration. gdb supports debugging multithreaded programs, and OpenOCD can inform gdb of various processes running on the target hardware by mapping them as threads. If the target has debug symbols enabled and is running ChibiOS, ThreadX, FreeRTOS, eCos, or Linux, gdb will list processes under it's "info threads" table, and the user can switch between tasks by selecting the thread by number.
The OpenOCD package is an extremely powerful addition to the open hardware toolbox. Its versatility means that just about anything that can wiggle pins is capable of becoming a hardware debugger, and the wide availability of commodity hardware means that these powerful tools are available to those without a million-dollar R&D budget. When combined with open hardware and open embedded operating systems, the root causes of mysterious crashes and deadlocks become obvious. By spending less time tracking down these mundane problems, developing for constrained platforms becomes more enjoyable, allowing the developer to think more about cool new features or ideas, and to generally have more fun.
Hardware
A collection of articles on the current state and future of open hardware.


1 Comment