

Data logging can be done for various reasons. In a previous article, I wrote about how I monitor the electricity consumption of my household. The Raspberry Pi platform is a perfect match for such applications as it allows communication with many kinds of analog and digital sensors. This article shows how to log the CPU temperature of a Raspberry Pi and create a spreadsheet-based report on demand. Logging the CPU temperature won't require any additional boards or sensors.
Even without a Raspberry Pi, you can follow the steps described here if you replace the specific parts of the code.
Setup
The code is based on Pythonic, a graphical Python programming fronted. The easiest way to get started with Pythonic is to download and flash the Raspberry Pi image. If you don't have a Raspberry Pi, use one of the other installation methods mentioned on the GitHub page (e.g., Docker or Pip).
Once installed, connect the Raspberry Pi to the local network. Next, open the web-based GUI in a browser by navigating to https://pythonicrpi:7000/.
You should now see the following screen:
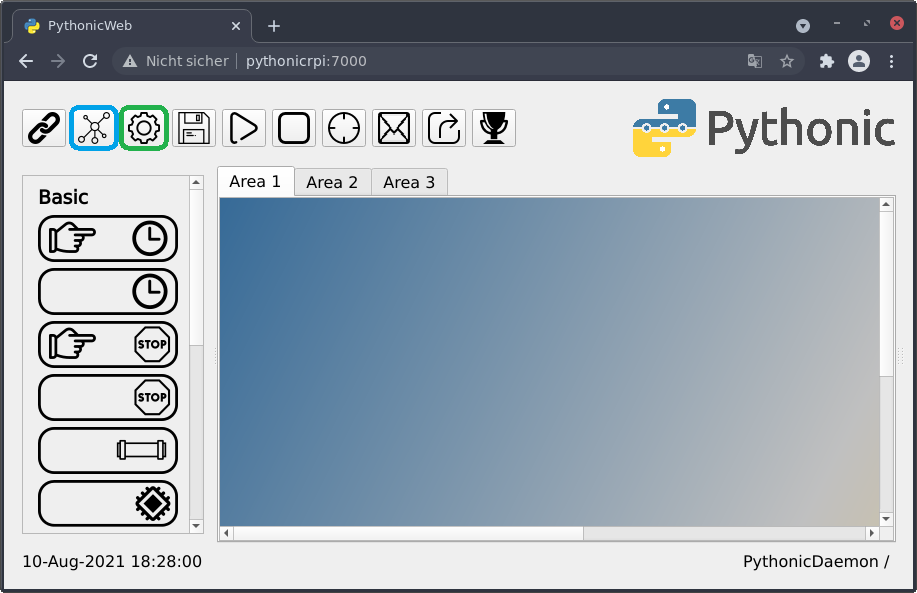
(Stephan Avenwedde, CC BY-SA 4.0)
Download and unzip the example available on GitHub. The archive consists of several file types.
Use the green-marked button to upload the current_config.json, with the yellow-marked button upload the XLSX file and the remaining *.py files.
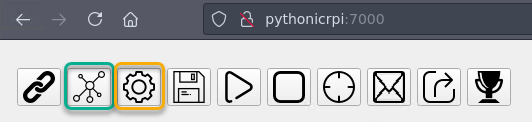
(Stephan Avenwedde, CC BY-SA 4.0)
You should have this configuration in front of you after you upload the files:
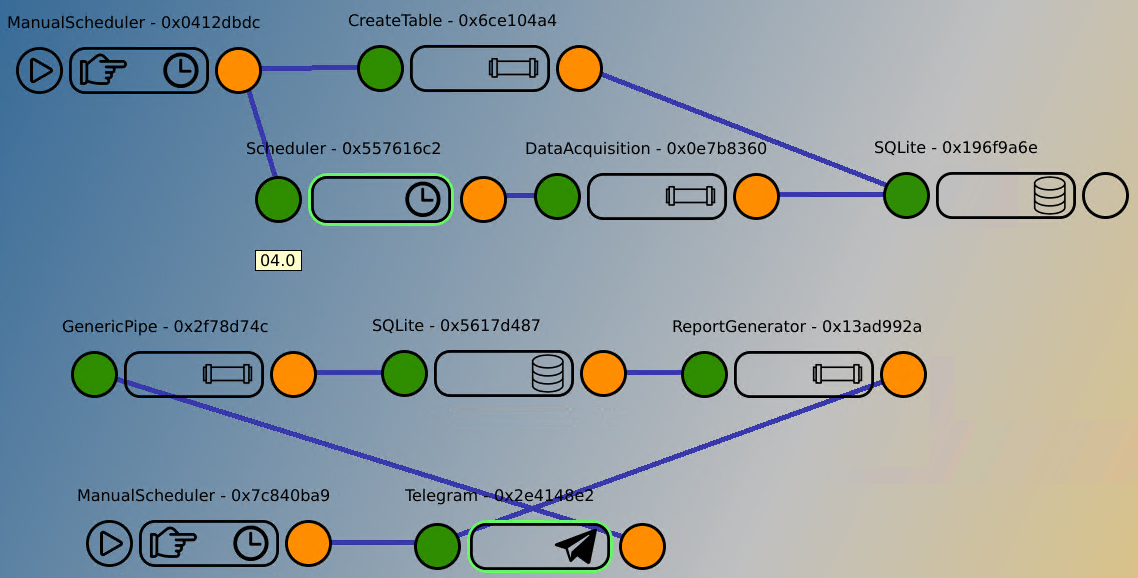
(Stephan Avenwedde, CC BY-SA 4.0)
Implementation
The application can be separated into two logical parts: Logging and report generation. Both parts run independently from each other.
Logging
The top part of the configuration can be summarized as the logging setup:
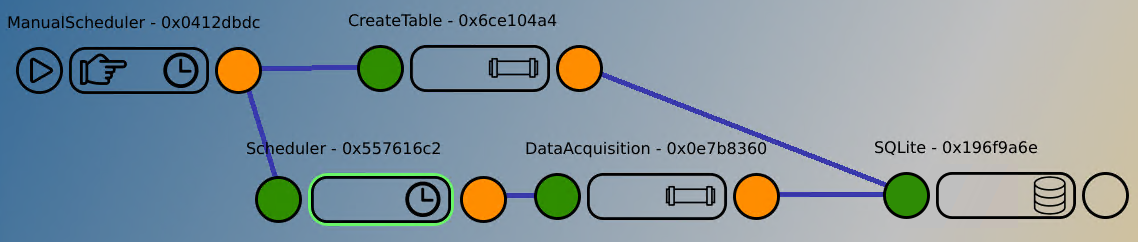
(Stephan Avenwedde, CC BY-SA 4.0)
Involved elements:
- ManualScheduler - 0x0412dbdc: Triggers connected elements on startup (or manually).
- CreateTable - 0x6ce104a4: Assembles an SQL query which creates the working table (if not already existent).
- Scheduler - 0x557616c2: Triggers subsequent element every 5 seconds.
- DataAcquisition - 0x0e7b8360: Here we collect the CPU temperature and assemble an SQL query.
- SQLite - 0x196f9a6e: Represents an SQLite database, accepts the SQL queries.
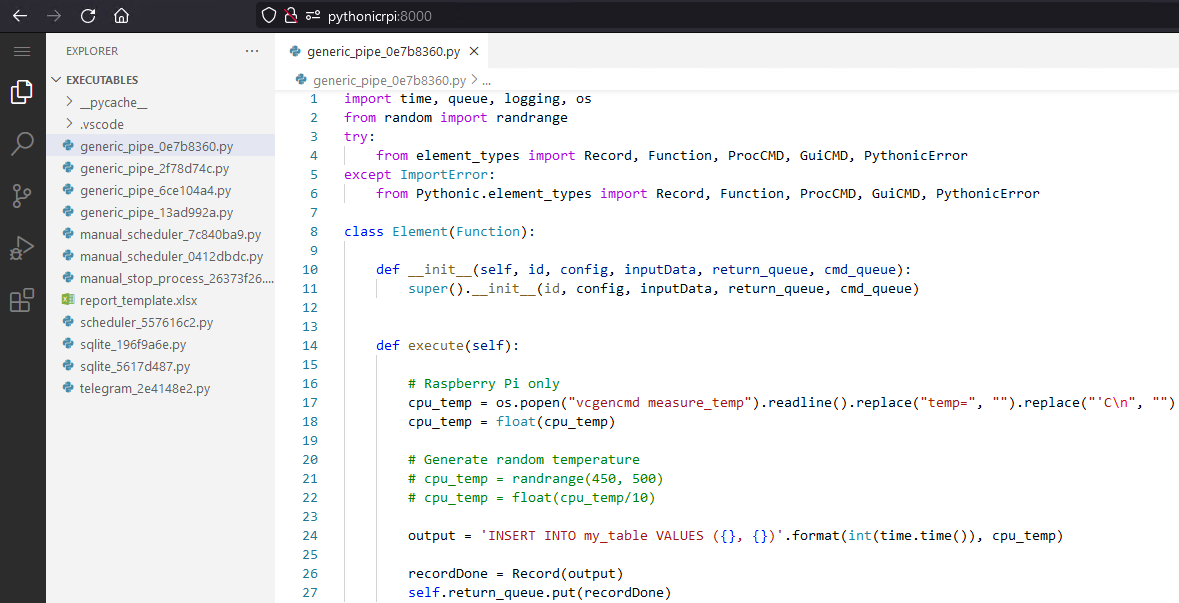
I will take a closer look at DataAcquisition - 0x0e7b8360. Open the built-in web editor (code-server) by navigating to https://pythonicrpi:8000/. You can see all the element-related *.py files in the left pane. The DataAcquisition element is based on the type Generic Pipe. Open the file with the related id:
generic_pipe_0x0e7b8360.py
(Stephan Avenwedde, CC BY-SA 4.0)
In this element, responsible for reading the CPU temperature, you can uncomment the lines of code depending on whether you're running this on a Raspberry Pi or not.
The above code produces an SQL query that inserts a row in the table my_table containing the Unix timestamp in seconds and the actual CPU temperature (or a random number). The code is triggered every five seconds by the previous element (Scheduler - 0x557616c2). The SQL query string is forwarded to the connected SQLite - 0x196f9a6e element, which applies the query to the related SQLite database on the file system. The process logs the CPU temperature in the database with a sampling rate of 1/5 samples per second.
Report generation
The bottom network generates a report on request:
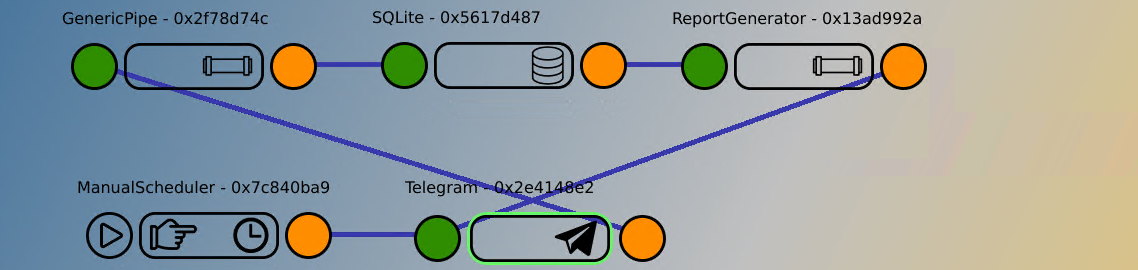
(Stephan Avenwedde, CC BY-SA 4.0)
Involved elements:
- ManualScheduler - 0x7c840ba9: Activates the connected Telegram bot on startup (or manually).
- Telegram - 0x2e4148e2: Telegram bot which serves an interface for requesting and providing of reports.
- GenericPipe- 0x2f78d74c: Assembles an SQL query comprising the data of the report.
- SQLite - 0x5617d487:
- ReportGenerator- 0x13ad992a: Create a XLSX-based report based on the data.
The example code contains a spreadsheet template (report_template.xlsx) which also belongs to this configuration.
Note: To get the Telegram bot running, provide a Telegram bot token to communicate with the server. core.telegram.org describes the process of creating a bot token.
The Telegram element outputs a request as a Python string when a user requests a report. The GenericPipe- 0x2f78d74c element that receives the request assembles a SQL query which is forwarded to the SQLite - 0x5617d487 element. The actual data, which is read based on the SQL query, is now sent to the ReportGenerator- 0x13ad992a, which I will take a closer look at:
generic_pipe_13ad992a.py
def execute(self):

	path = Path.home() / 'Pythonic' / 'executables' / 'report_template.xlsx'

	try:
		wb = load_workbook(path)
	except FileNotFoundError as e:
		recordDone = Record(PythonicError(e), 'Template not found')
		self.return_queue.put(recordDone)
		con.close()
		return
	except Exception as e:
		recordDone = Record(PythonicError(e), 'Open log for details')
		self.return_queue.put(recordDone)
		con.close()
		return

	datasheet = wb['Data']

	# create an iterator over the rows in the datasheet
	rows = datasheet.iter_rows(min_row=2, max_row=999, min_col=0, max_col=2)
In the first part, I use the load_workbook() of the openpyxl library to load the spreadsheet template. If successfully loaded, I acquire a reference to the actual sheet in the datasheet variable. Afterward, I create an iterator over the rows in the datasheet, which is stored in the variable rows.
	# Convert unix time [s] back into a datetime object, returns an iterator
	reportdata_dt = map(lambda rec: (datetime.datetime.fromtimestamp(rec[0]), rec[1]), self.inputData)

	# iterate till the first iterator is exhausted
	for (dt, val), (row_dt, row_val) in zip(reportdata_dt, rows):
		row_dt.value = dt
		row_val.value = val

	reportDate = datetime.datetime.now().strftime('%d_%b_%Y_%H_%M_%S')
	filename = 'report_{}.xlsx'.format(reportDate)
	filepath = Path.home() / 'Pythonic' / 'log' / filename
	wb.save(filepath)
	wb.close()

	recordDone = Record(filepath, 'Report saved under: {}'.format(filename))
	self.return_queue.put(recordDone)
The last part starts with the variable reportdata_dt: The variable holds an iterator which, when used, converts the raw Unix timestamp of the input data from the SQLite database (self.inputdata) back to a Python datetime object. Next, I zip the reportdata_dt iterator with the previously created rows iterator and iterate till the first of them is exhausted, which should be reportdata_dt. During iteration, I fill the columns of each row with the timestamp and the value. In the last step, I save the spreadsheet with a filename consisting of the actual date and time and forward the filename to the Telegram - 0x2e4148e2 element.
The Telegram - 0x2e4148e2 then loads the file from disk back into memory and sends it to the user who requested the report. This video shows the whole procedure:
The report the user receives look like this:
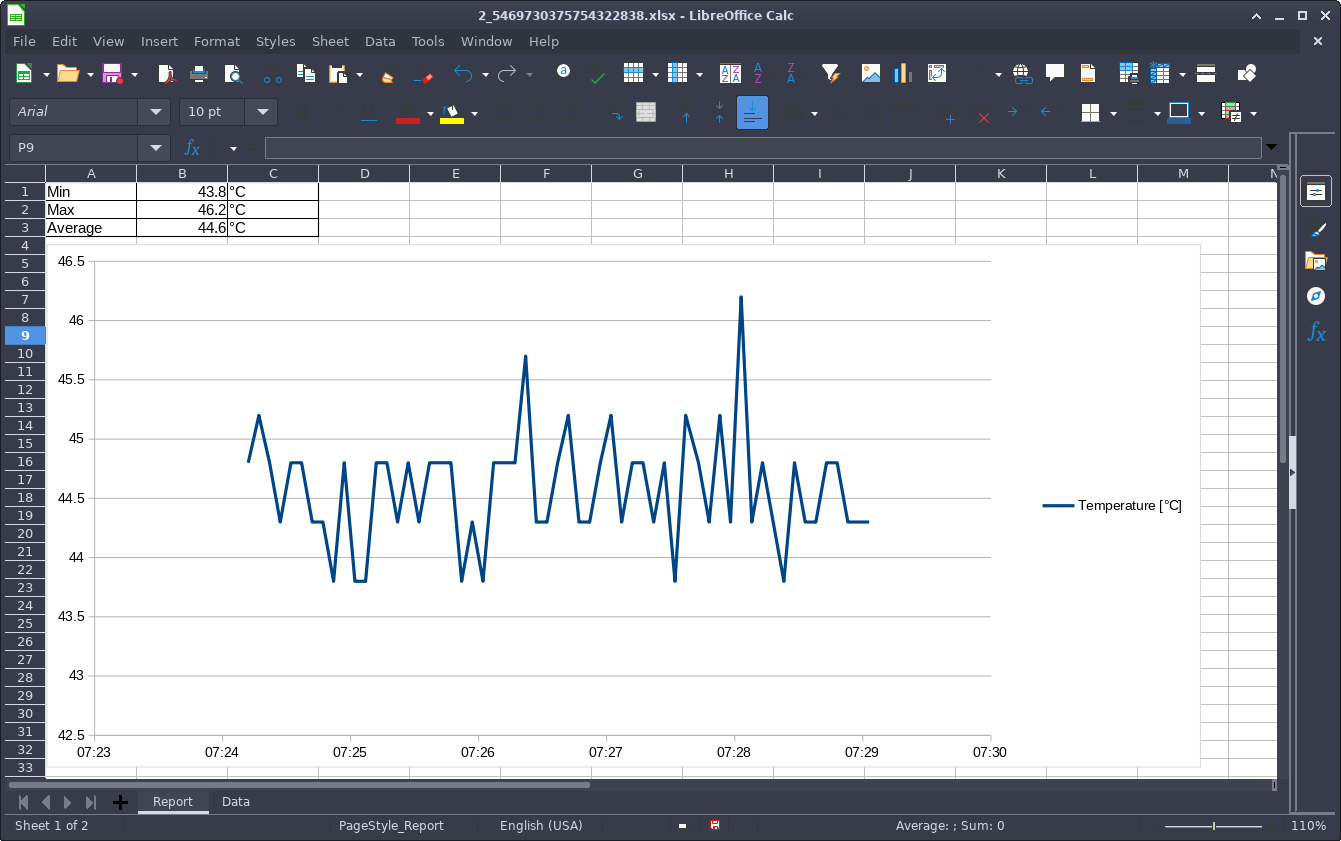
(Stephan Avenwedde, CC BY-SA 4.0)
Wrap up
This article shows how to easily convert the Raspberry Pi into a data logger. The Raspberry Pi platform allows you to interact with sensors of any kind, enabling you to monitor physical values as well as computed values. Using spreadsheets as the basis for your reports gives you a lot of flexibility and makes those reports very customizable. The openpyxl library in combination with Pythonic makes it simple to automate this process.


Comments are closed.