In this series celebrating Kubernetes' 11th birthday, I've introduced some great tools for chaos engineering. In the first article, I explained what chaos engineering is, and in the second, I demonstrated how to get your system's steady state so that you can compare it against a chaos state. In the next four articles, I introduced some chaos engineering tools: Litmus for testing arbitrary failures and experiments in your Kubernetes cluster; Chaos Mesh, an open source chaos orchestrator with a web user interface; Kube-monkey for stress-testing your systems by scheduling random termination pods in your cluster; and Kube DOOM for killing pods while having fun.
Now I'll wrap up this birthday present by putting it all together. Along with Grafana and Prometheus for monitoring for a steady state on your local cluster, I'll use Chaos Mesh and a small deployment and two experiments to see the difference between steady and not steady, as well as Pop!_OS 20.04, Helm 3, Minikube 1.14.2, and Kubernetes 1.19.
Configure Minikube
If you haven't already, install Minikube in whatever way that makes sense for your environment. If you have enough resources, I recommend giving your virtual machine a bit more than the default memory and CPU power:
$ minikube config set memory 8192
❗  These changes will take effect upon a minikube delete and then a minikube start
$ minikube config set cpus 6
❗  These changes will take effect upon a minikube delete and then a minikube start
Then start and check the status of your system:
$ minikube start
?  minikube v1.14.2 on Debian bullseye/sid
?  minikube 1.19.0 is available! Download it: https://github.com/kubernetes/minikube/releases/tag/v1.19.0
?  To disable this notice, run: 'minikube config set WantUpdateNotification false'

✨  Using the docker driver based on user configuration
?  Starting control plane node minikube in cluster minikube
?  Creating docker container (CPUs=6, Memory=8192MB) ...
?  Preparing Kubernetes v1.19.0 on Docker 19.03.8 ...
?  Verifying Kubernetes components...
?  Enabled addons: storage-provisioner, default-storageclass
?  Done! kubectl is now configured to use "minikube" by default
$ minikube status
minikube
type: Control Plane
host: Running
kubelet: Running
apiserver: Running
kubeconfig: Configured
Preinstall pods with Helm
Before moving forward, you'll need to deploy some pods into your cluster. To do this, I generated a simple Helm chart and changed the replicas in my values file from 1 to 8.
If you need to generate a Helm chart, you can read my article on creating a Helm chart for guidance. I created a Helm chart named nginx and created a namespace to install my chart into using the commands below.
Create a namespace:
$ kubectl create ns nginxInstall the chart in your new namespace with a name:
$ helm install chaos-pods nginx -n nginx

NAME: chaos-pods
LAST DEPLOYED: Sun May 23 10:15:52 2021
NAMESPACE: nginx
STATUS: deployed
REVISION: 1
NOTES:
1. Get the application URL by running these commands:
  export POD_NAME=$(kubectl get pods --namespace nginx -l "app.kubernetes.io/name=nginx,app.kubernetes.io/instance=chaos-pods" -o jsonpath="{.items[0].metadata.name}")
  export CONTAINER_PORT=$(kubectl get pod --namespace nginx $POD_NAME -o jsonpath="{.spec.containers[0].ports[0].containerPort}")
  echo "Visit http://127.0.0.1:8080 to use your application"
  kubectl --namespace nginx port-forward $POD_NAME 8080:$CONTAINER_PORT
Monitoring and marinating
Next, install and set up Prometheus and Grafana following the steps in the second article in this series. However, you'll need to make make the following changes in the installation:
$ kubectl create ns monitoring

$ helm install prometheus prometheus-community/prometheus -n monitoring

$ helm install grafana bitnami/grafana -n monitoring
Now that everything is installed in separate namespaces, set up your dashboards and let Grafana marinate for a couple of hours to catch a nice steady state. If you're in a staging or dev cluster at work, it would be even better to let everything sit for a week or so.
For this walkthrough, I will use the K8 Cluster Detail Dashboard (dashboard 10856), which provides various drop-downs with details about your cluster.
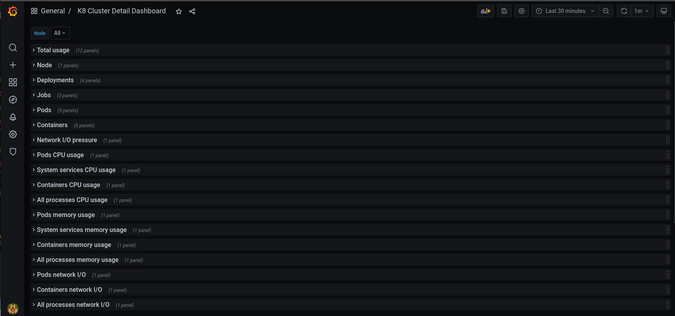
(Jess Cherry, CC BY-SA 4.0)
Test #1: Container killing with Grafana and Chaos Mesh
Install and configure Chaos Mesh using the steps in my previous article. Once that is set up, you can add some new experiments to test and observe with Grafana.
Start by setting up an experiment to kill containers. First, look at your steady state.
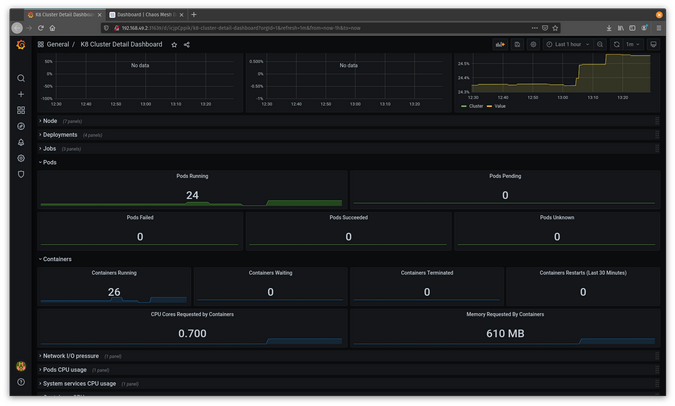
(Jess Cherry, CC BY-SA 4.0)
Next, make a kill-container experiment pointed at your Nginx containers. I created an experiments directory and then the container-kill.yaml file:
$ mkdir experiments
$ cd experiments/
$ touch container-kill.yaml
The file will look like this:
apiVersion: chaos-mesh.org/v1alpha1
kind: PodChaos
metadata:
  name: container-kill-example
  namespace: nginx
spec:
  action: container-kill
  mode: one
  containerName: 'nginx'
  selector:
    labelSelectors:
      'app.kubernetes.io/instance': 'nginx'
  scheduler:
    cron: '@every 60s'
Once it starts, this experiment will kill an nginx container every minute.
Apply your file:
$ kubectl apply -f container-kill.yaml
podchaos.chaos-mesh.org/container-kill-example created
Now that the experiment is in place, watch it running in Chaos Mesh.
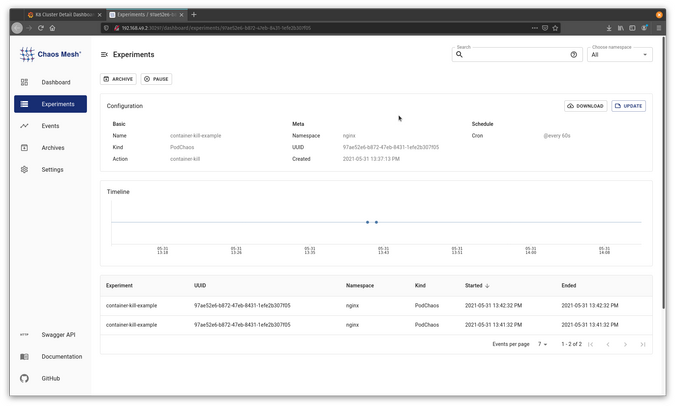
(Jess Cherry, CC BY-SA 4.0)
You can also look into Grafana and see a notable change in the state of the pods and containers.
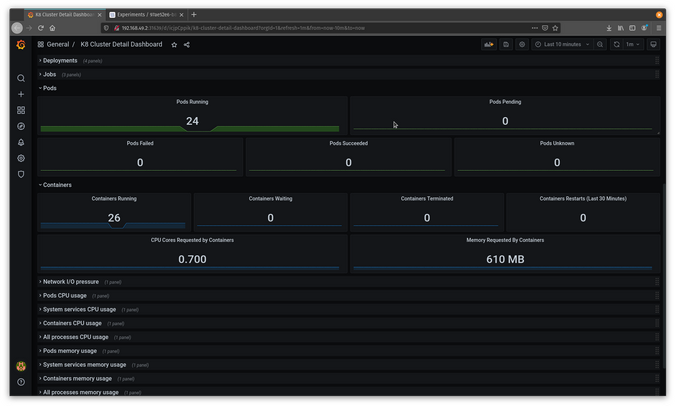
(Jess Cherry, CC BY-SA 4.0)
If you change the kill time and reapply the experiment, you will see even more going on in Grafana. For example, change @every 60s to @every 30s and reapply the file:
$ kubectl apply -f container-kill.yaml
podchaos.chaos-mesh.org/container-kill-example configured
$
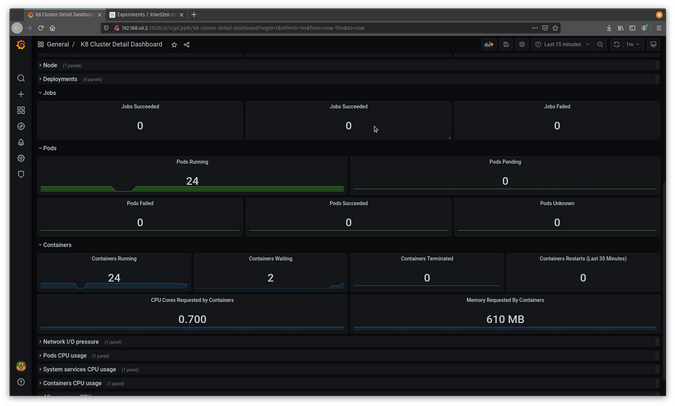
You can see the disruption in Grafana with two containers sitting in waiting status.
(Jess Cherry, CC BY-SA 4.0)
Now that you know how the containers reacted, go into the Chaos Mesh user interface and pause the experiment.
Test #2: Networking with Grafana and Chaos Mesh
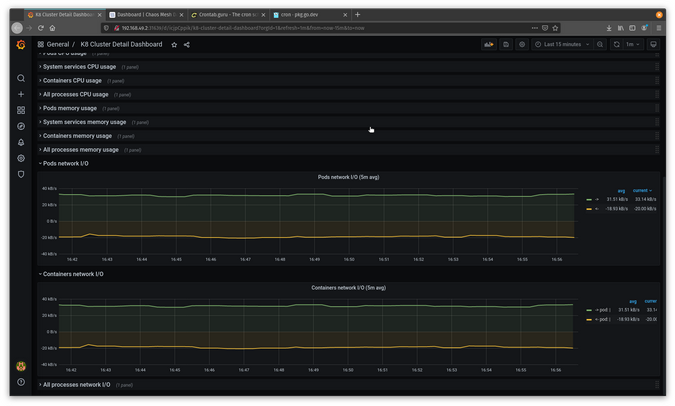
The next test will work with network delays to see what happens if there are issues between pods. First, grab your steady state from Grafana.
(Jess Cherry, CC BY-SA 4.0)
Create a networkdelay.yaml file for your experiment:
$ touch networkdelay.yamlThen add some network delay details. This example runs a delay in the nginx namespace against your namespace instances. The packet-sending delay will be 90ms, the jitter will be 90ms, and the jitter correlation will be 25%:
apiVersion: chaos-mesh.org/v1alpha1
kind: NetworkChaos
metadata:
  name: network-delay-example
  namespace: nginx
spec:
  action: delay
  mode: one
  selector:
    labelSelectors:
      'app.kubernetes.io/instance': 'nginx'
  delay:
    latency: "90ms"
    correlation: "25"
    jitter: "90ms"
  duration: "45s"
  scheduler:
    cron: "@every 1s"
Save and apply the file:
$ kubectl apply -f  networkdelay.yaml
networkchaos.chaos-mesh.org/network-delay-example created
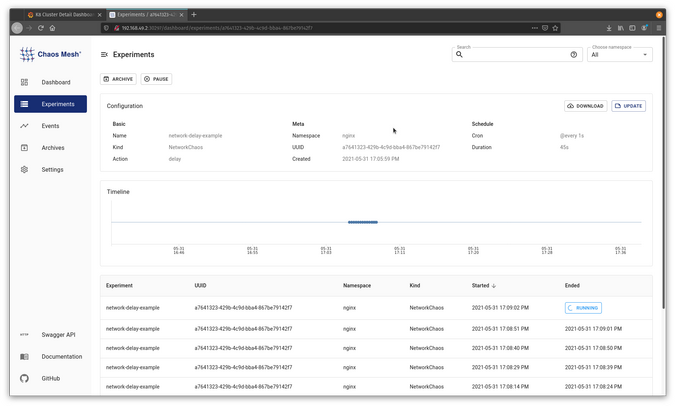
It should show up in Chaos Mesh as an experiment.
(Jess Cherry, CC BY-SA 4.0)
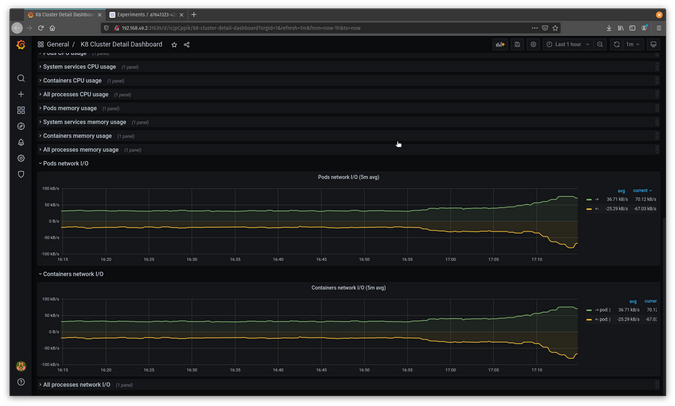
Now that it is running pretty extensively using your configuration, you should see an interesting, noticeable change in Grafana.
(Jess Cherry, CC BY-SA 4.0)
In the graphs, you can see the pods are experiencing a delay.
Congratulations! You have a more detailed way to keep track of and test networking issues.
Chaos engineering final thoughts
My gift to celebrate Kubernetes' birthday is sharing a handful of chaos engineering tools. Chaos engineering has a lot of evolving yet to do, but the more people involved, the better the testing and tools will get. Chaos engineering can be fun and easy to set up, which means everyone—from your dev team to your administration—can do it. This will make your infrastructure and the apps it hosts more dependable.
Happy birthday, Kubernetes! I hope this series was a good gift for 11 years of being a cool project.


3 Comments